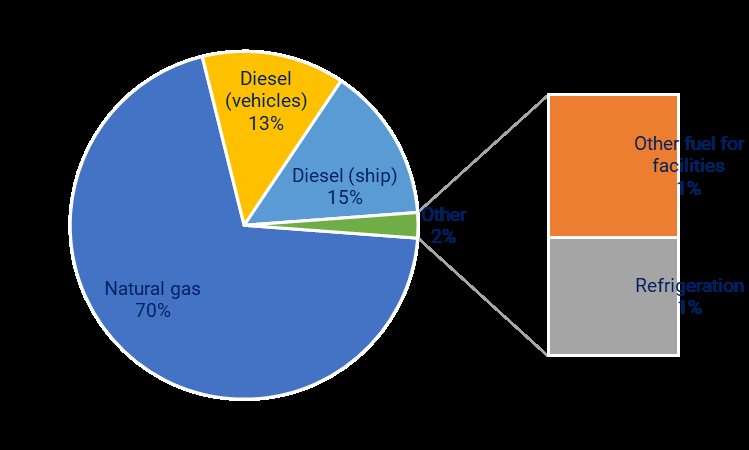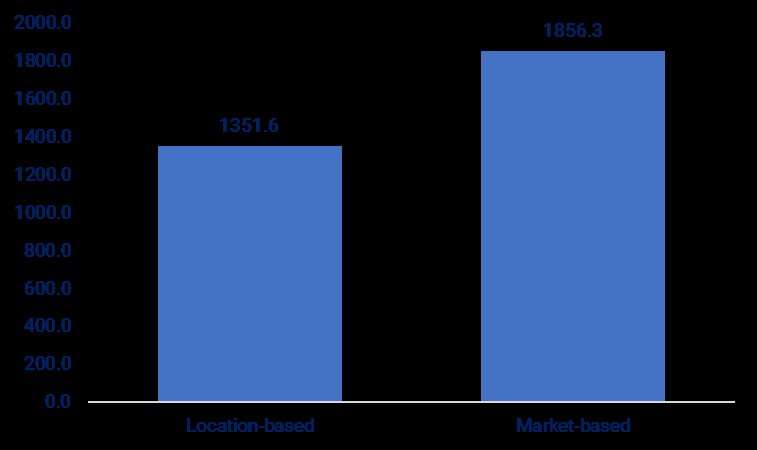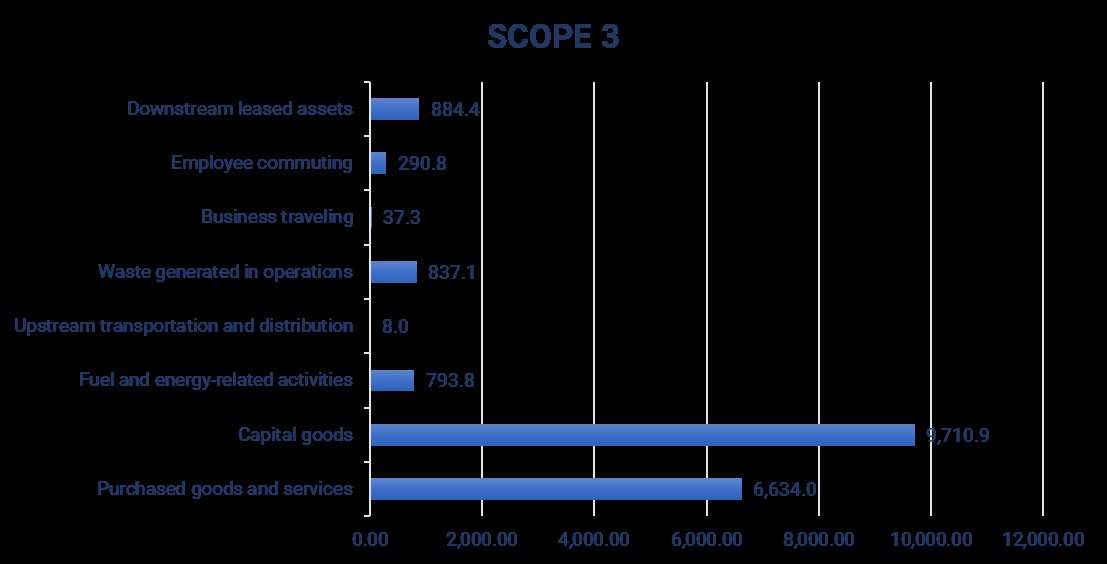

| Green Port Master Plan · Handbook

GPMP Toolbox

| Green Port Master Plan · Handbook

GPMP Toolbox
Pioneers
Green Port Master Plan · Handbook
GPMP Toolbox

Plan your port’s path
to a green 2050.

A practical, five-step method to move your port from where it is today toward a climate-neutral and resilient future, at any size or starting point.

Anchored in the transition management framework “Multi-Level Perspective (MLP)”, this five-step process takes into account three interconnected levels in the port ecosystem: the world around you (landscape), your port today (regime) and innovations (niches). Together they shape the pace and direction of the transition to a climate-neutral port.

Today

Vision 2050

Plan your port’s path to a green 2050 step by step.

Your 2050 vision Your port today The world around you Innovations Build your roadmap
Vision · Where you want to be

Your 2050 vision

The path to a climate-neutral port runs through deep uncertainty. Market dynamics, price evolutions, consumer behavioral changes, etc., makes future envisioning and planning very challenging as these aspects cannot be reliably predicted. Future envisioning does not try to predict. It prepares a port for a range of possible futures so that today’s decisions hold up whichever one arrives, and it gives the organization a desirable future worth steering toward.

Tools for this step

Scenario building and backcasting
Best-practice examples

Port of Antwerp-Bruges: Green Ports in 2050 ›
Port of Venlo ›
Port of Barcelona ›
Background knowledge

Regime · Know your own system

Your port today

Ports are different. They operate under different geographical, climatic, infrastructural, economic, and regulatory conditions. They serve different transport modes and supply chains, have different connections to cities and hinterlands, and face different conditions depending on their access to the sea, rivers, or other waterways. Their size, functions, governance structures, available infrastructure, and local ecosystems also vary considerably.

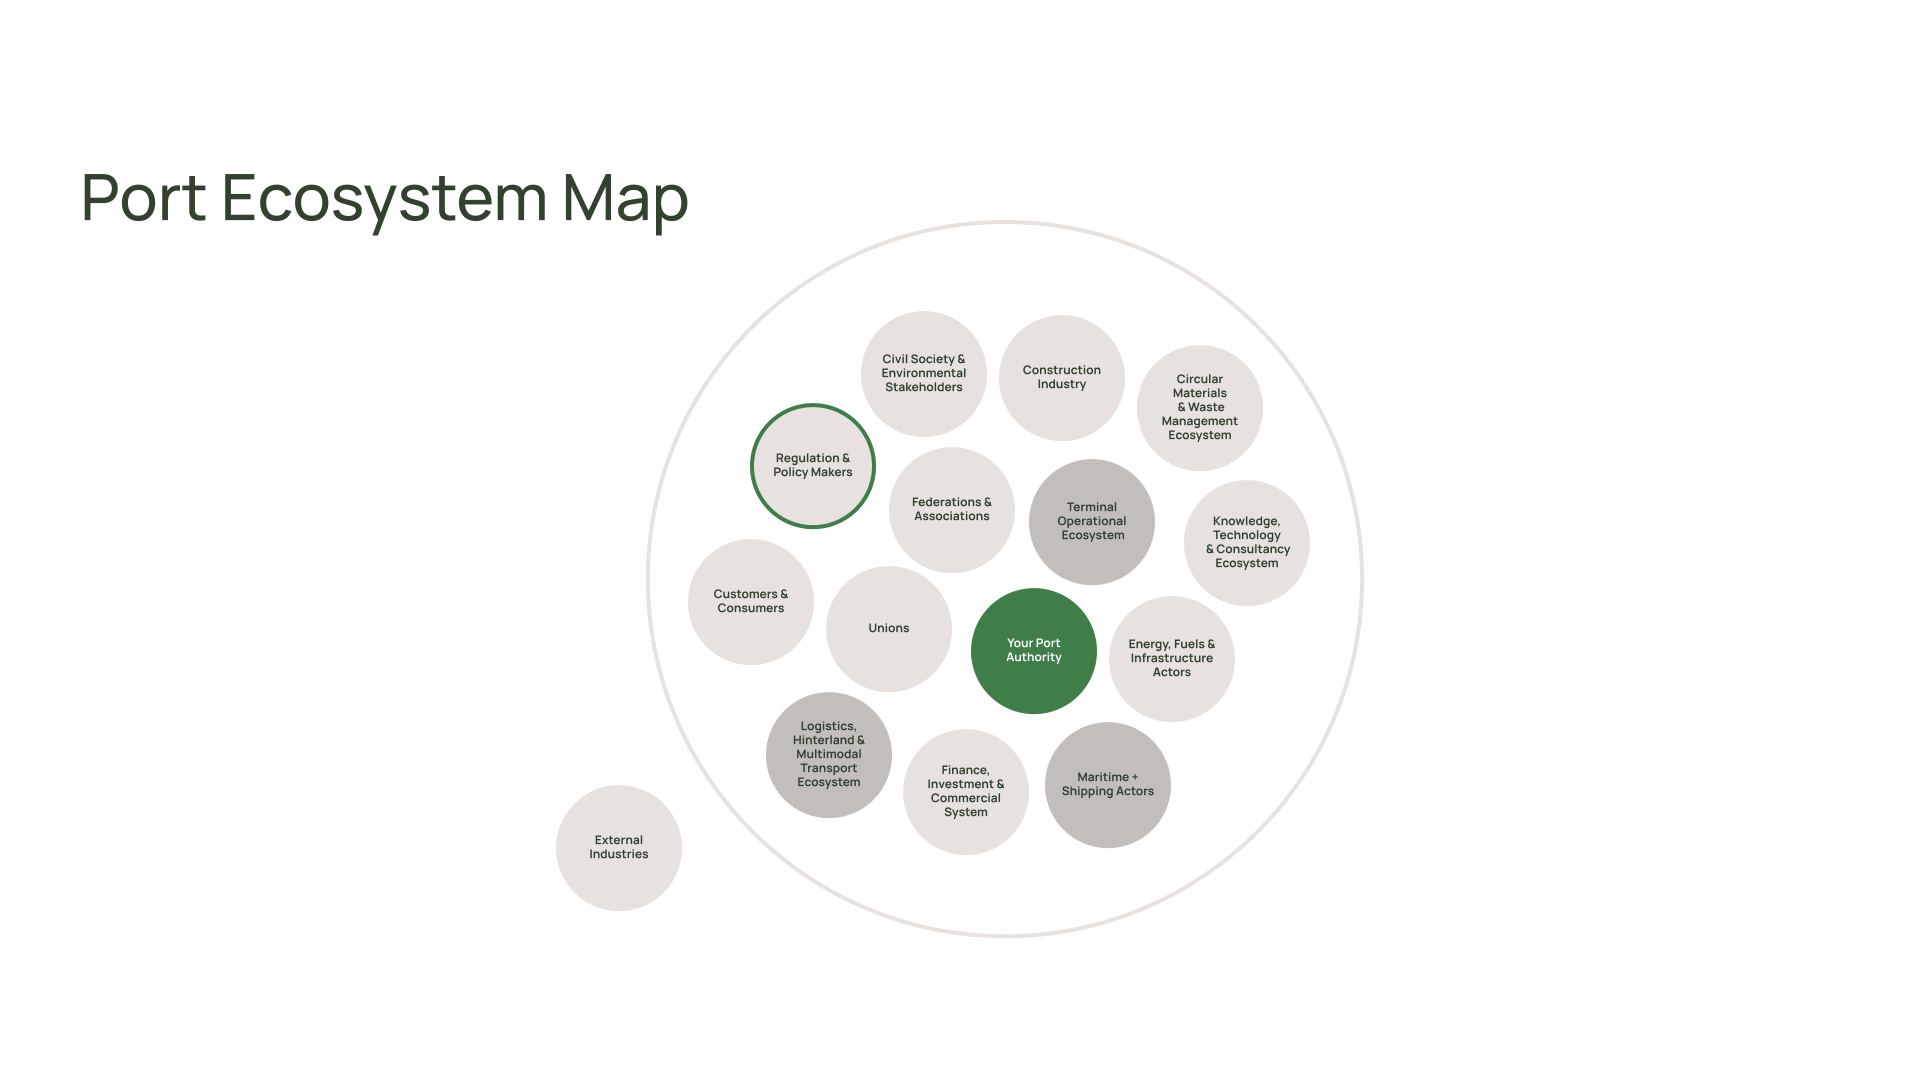
A successful transition starts with a clear understanding of the port itself and its ecosystem. The Port Today phase is therefore all about the port ecosystem and the knowledge a port has of its own environment. It establishes the status quo and provides the evidence base from which future ambitions, pathways and actions are developed. We suggest the following sections for this chapter:

Characterise your port ecosystem and its stakeholders.
Determine your current environmental footprint as a starting point.
Understanding the port ecosystem.
Tools for this step

Practical methods for stakeholder engagement
Stakeholder groups and methods of engagement
Mapping stakeholders and engagement strategies
Engagement methods and communication channels
Engagement barriers
Digitalising Carbon Footprint Monitoring
Problem exploration
Best-practice examples

Stakeholder engagement in the Port of Venlo ›
Port of Constanța ›
System mapping in the Port of Antwerp-Bruges ›
Background knowledge

Landscape · Forces you must plan for

The world around you

Within the Multi-Level Perspective (MLP), the Landscape represents the broader socio-economic, environmental, technological and political context within which port systems evolve. The Landscape developments originate largely outside the direct influence of ports. They emerge gradually over long periods and create persistent pressures that shape the decisions of governments, industries and infrastructure operators. Consequently, ports cannot control these developments, but they must continuously adapt to them to remain competitive, resilient and sustainable.

Historically, ports developed primarily in response to economic growth, increasing cargo volumes and advances in transport technologies. Today, this development model is being reshaped by the combined influence of Global Megatrends, including Climate Change, Energy Transition & Decarbonisation, the Technological and Digital Revolution, Shifting Global Trade & Geopolitical Order, Demographic & Socio-economic Transformation, and Resilience & Systemic Awareness. These trends interact and reinforce one another, creating cumulative pressures that transform the existing port regime. Climate policies accelerate technological innovation, digitalisation supports decarbonisation, geopolitical instability reshapes supply chains, and evolving societal expectations influence investment priorities and governance. Together, these developments redefine ports from transport gateways into integrated logistical, industrial and energy supplying ecosystems, providing the broader context for the subsequent Scenario Analysis and the development of Green Port Masterplans.

Global megatrends.
Meso-Level Responses.
Tools for this step

Identifying, structuring and estimating the impact of trends on the port system
Best-practice examples

Port of Venlo ›
Background knowledge

Innovations · New solutions

Innovations to use

In the Multi-Level Perspective, innovations encompass new ideas, technologies, and collaborations. These innovations can manifest in various forms, such as pilot projects, demonstration sites, or experimental collaborations centered around novel technologies, business models, or governance approaches. While not all innovations achieve success, those that do have the potential to grow and eventually challenge the existing regime – just like the PIONEERS demo-showcases. In general, Innovations are affecting the port system in two ways:


Innovations introduce new ways ports are operating more cost-efficient. In this way, Innovations pressuring port system to change and adopt to remain competitive.


Innovations can serve as solutions to cope with the dynamically evolving landscape pressures over time.


In the context of the Green Port Master Plan (GPMP), Innovations shall be approached in a pragmatic way.

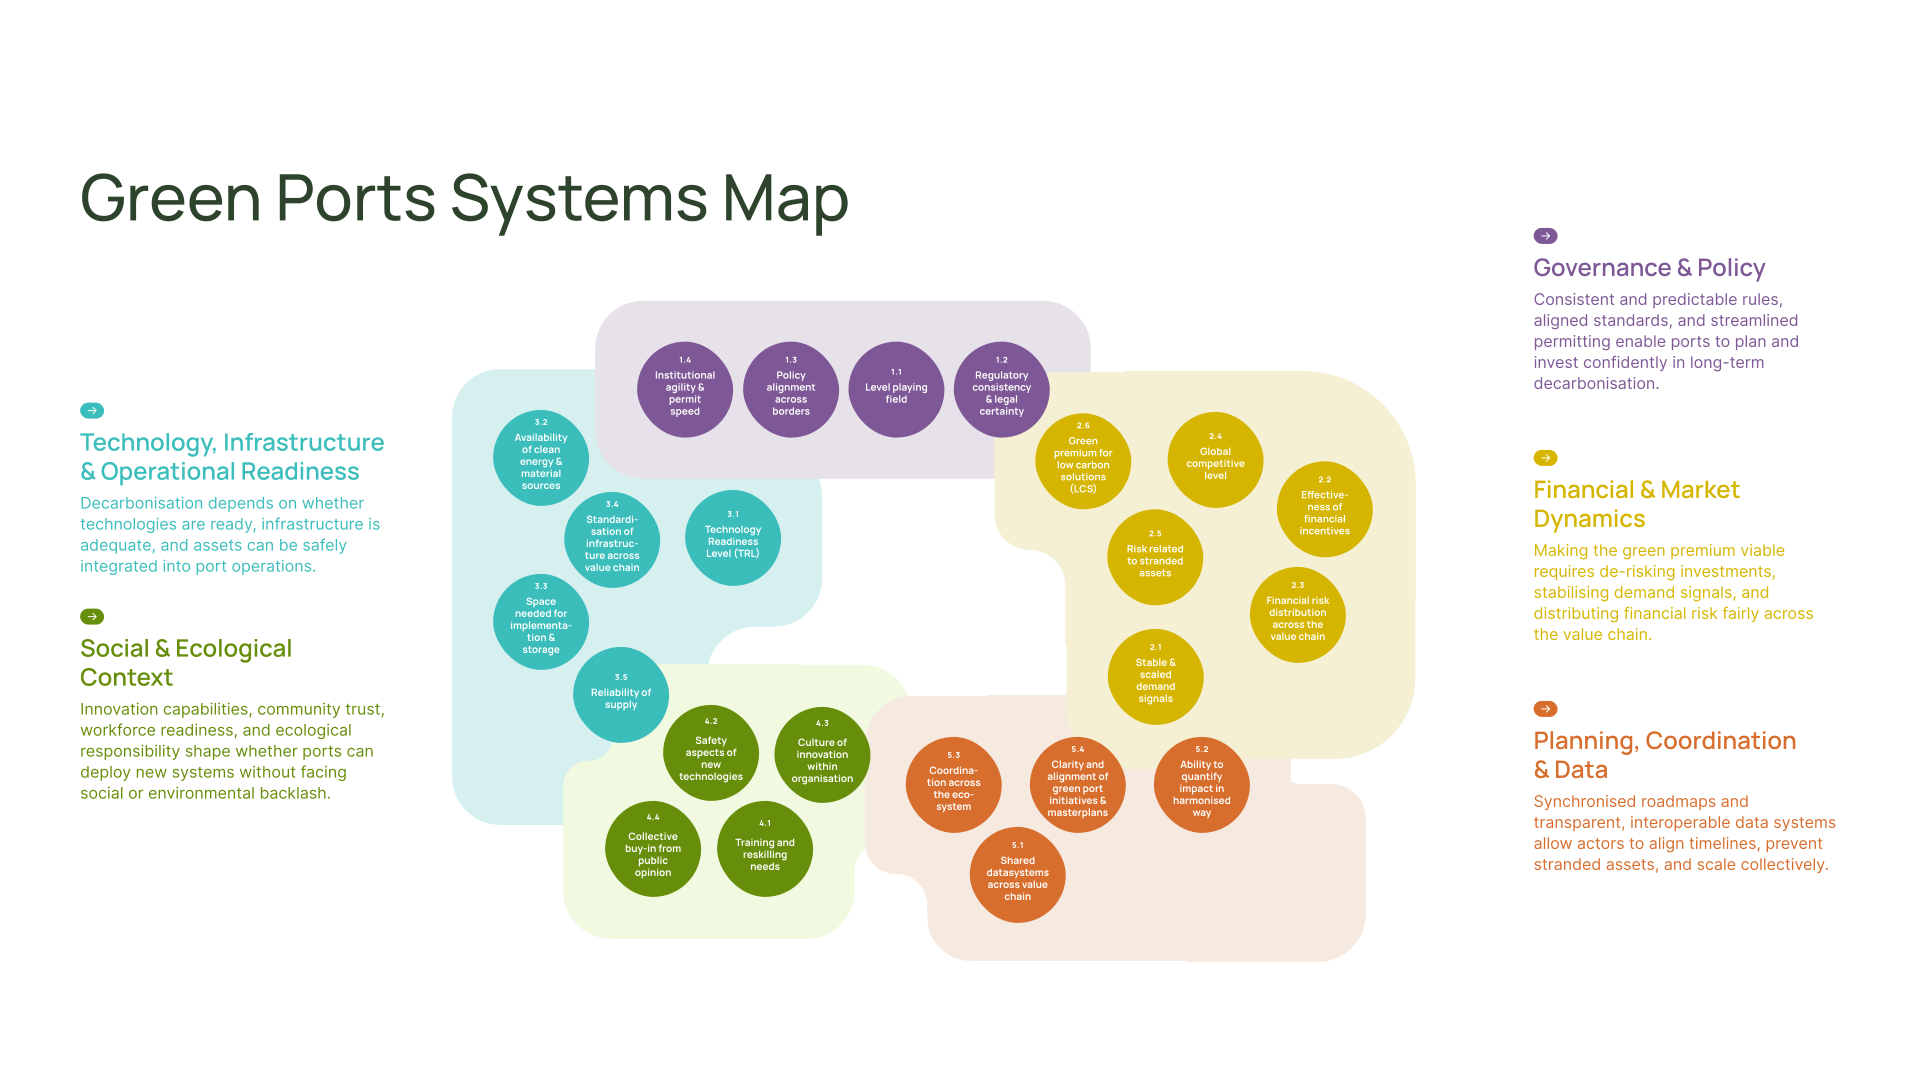
Technology capabilities are a key consideration, while the right fit for the port’s strategic role, operational reality, institutional setting, and decarbonisation trajectory need to be considered as well. In this sense, Innovations and niches are the process step to move from vision to prioritisation by treating niches as decision domains such as energy, logistics, infrastructure, digital operations, governance, and organisational change. Each of these contain innovations that are either enabling or limiting the port’s ability to achieve its green transition goals as part of their roadmap (Bjerkan & Ryghaug, 2021).


There are a wide range of innovations dynamically evolving around port systems, including shore power, electrification, renewable energy integration, alternative fuels, digital optimisation, automation, data-sharing platforms, and new collaborative business models. An important process step of the GPMP is to identify and assess relevant innovations, which are addressing an identified challenge, a meaningful contribution to the GPMP objectives and high upscale potential.

Tools for this step

Innovation scouting and innovation radar
PAM assessment
Background knowledge

Roadmap · From vision to action

Build your roadmap

The roadmap is a collection of initiatives that a port will implement to achieve the decarbonization goals set forward. They are a collection of niches that after careful consideration through the port readiness assessment are deemed to be the best fitting solutions for the specific port environment.


A timeline is used to plan the initiative according to when they will be implemented in the port. This roadmap is constantly updated and challenged due to the nature of the initiatives that are constantly pressuring the port environment.
Tools for this step

Co-Transferability
Best-practice examples

Port of Barcelona ›
Open the toolbox

Create your account

GPMP Toolbox

One place for the methods & deliverables

The curated PIONEERS tools that support each step of the master plan, your strategizing backbone, linked to where you use it.

01
Scenario building and backcasting

A proven method for future envisioning is scenario planning

Used in · Your 2050 vision

02
Practical methods for stakeholder engagement

In the development of a GPMP, your port stakeholders play a key role.

Used in · Your port today

03
Stakeholder groups and methods of engagement

Use this list as a starting checklist during the Discover phase.

Used in · Your port today

04
Mapping stakeholders and engagement strategies
Used in · Your port today

05
Engagement methods and communication channels
Used in · Your port today

06
Engagement barriers
Used in · Your port today

07
Digitalising Carbon Footprint Monitoring

Calculating greenhouse gas (GHG) emissions is only the first step towards effective carbon management.

Used in · Your port today

08
Problem exploration

Within PIONEERS, all four ports used the Multi-Level Perspective (MLP) as the foundation for their problem-identification methodology.

Used in · Your port today

09
Identifying, structuring and estimating the impact of trends on the port system

The Landscape Analysis identifies the long-term external developments that influence the future of the port system but remain largely outside the direct control of the port authority.

Used in · The world around you

10
Innovation scouting and innovation radar

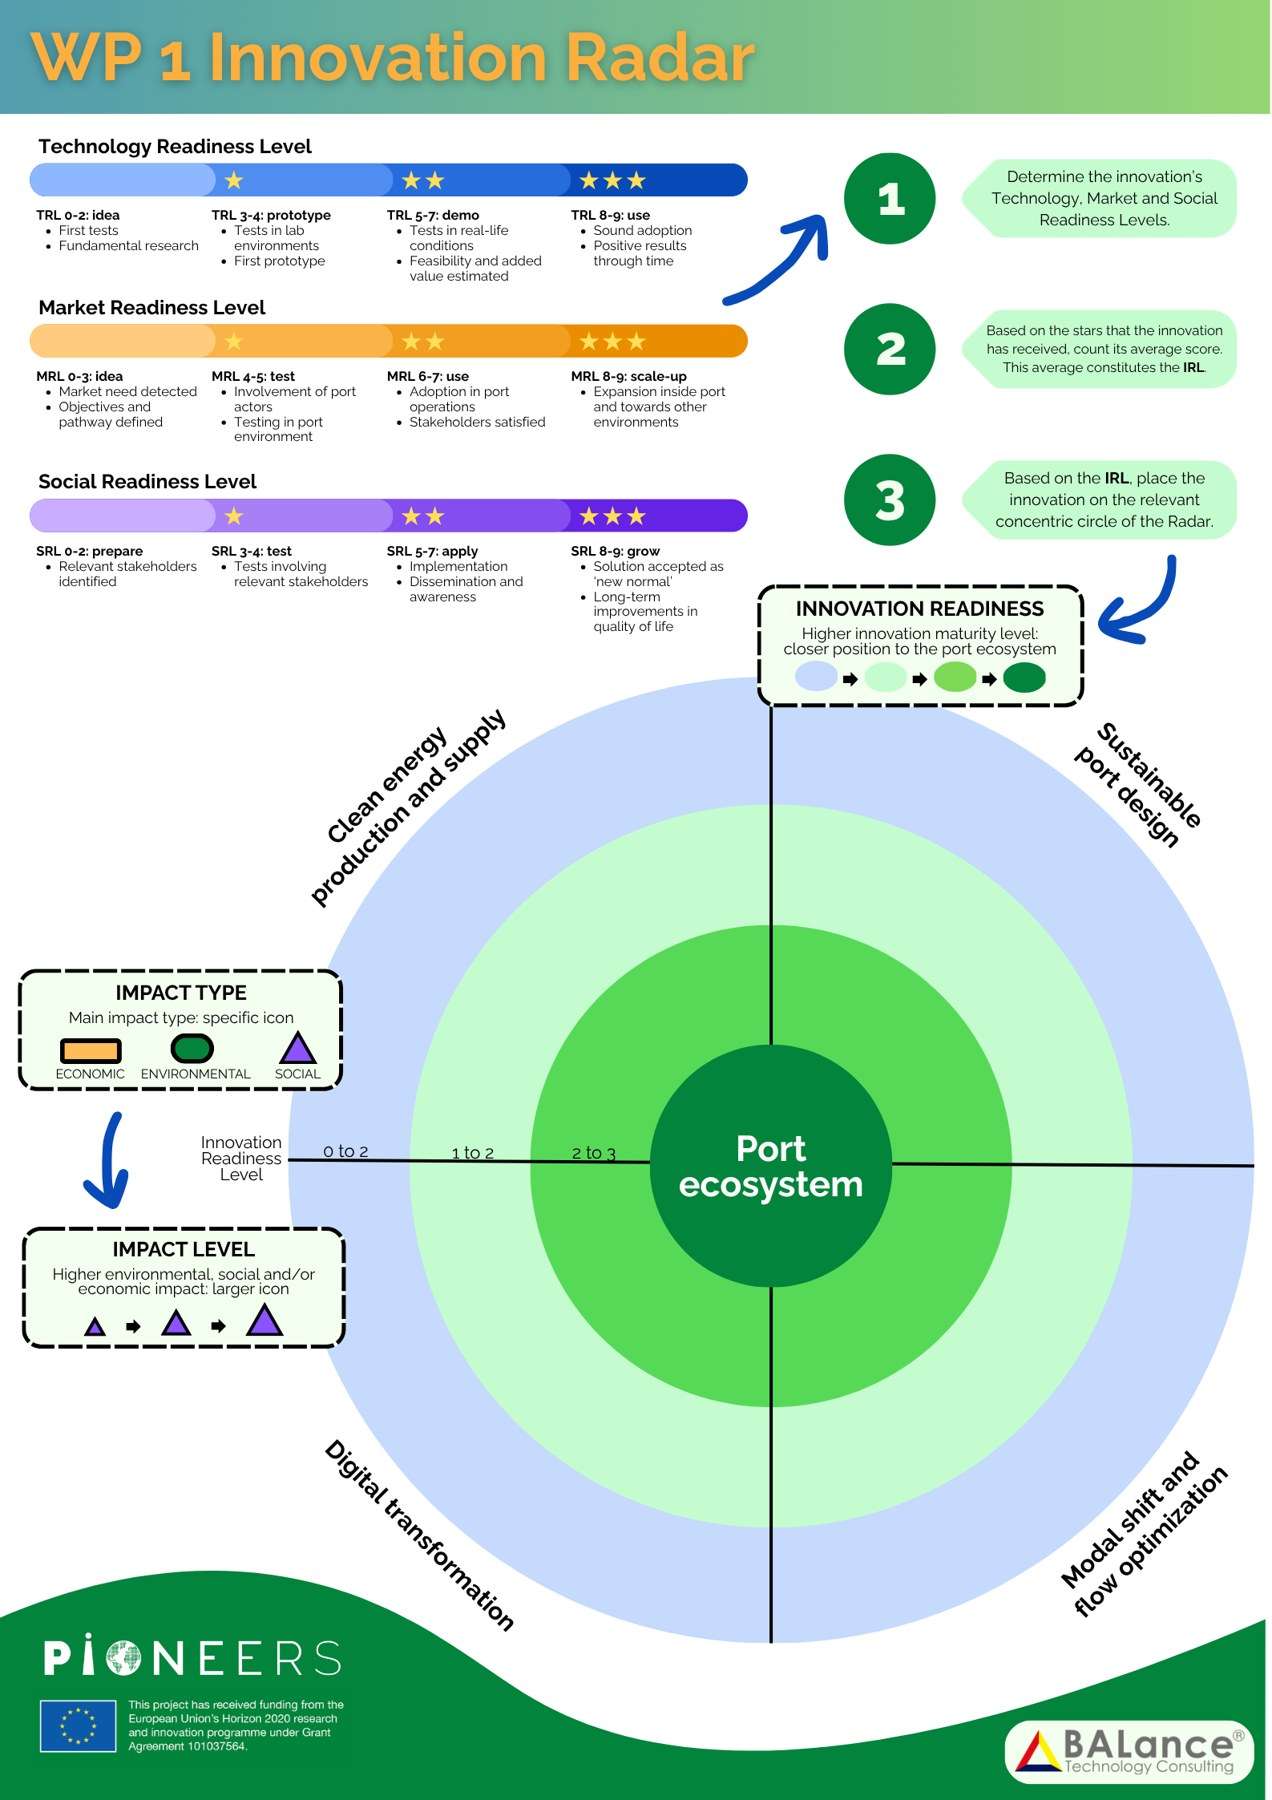
Innovation scouting and the innovation radar developed in PIONEERS Work Package 1 provides a broad and evolving overview of relevant innovations and niche developments in ports and beyond.

Used in · Innovations

11
PAM assessment

One of the tools developed within PIONEERS was the PIONEERS Assessment Model (PAM).

Used in · Innovations

12
Co-Transferability

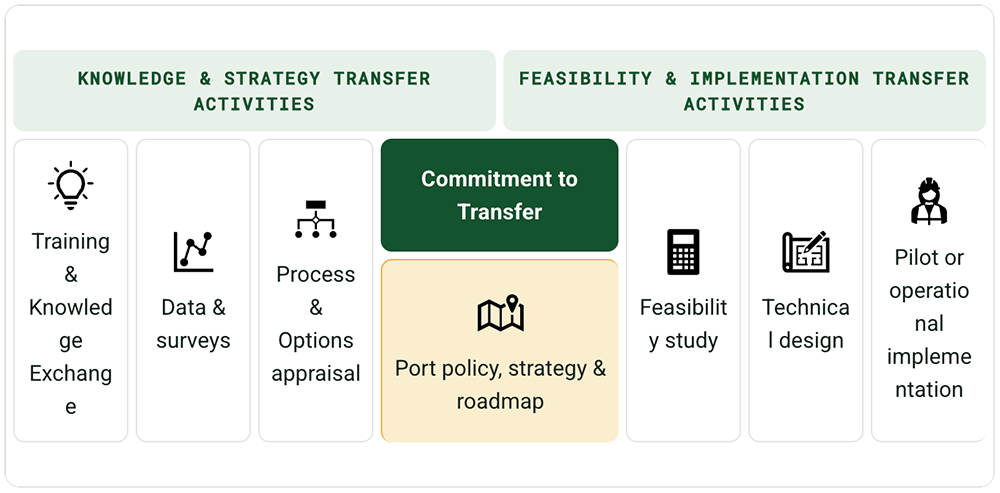
The co-transferability workstream of the PIONEERS project set in place a process to “…drive accelerated transfer and deployment of green port solutions amongst the PIONEERS ports, resulting in measurable progress and commitments during and beyond the project timeframe.” By sharing the transferability framework and methods applied by the partners of the PIONEERS project, as well as the main lessons learned, we hope to inspire and inform future similar innovation transfer processes – whether these are implemented by similar multi-party consortia, or independently by port authorities.

Used in · Build your roadmap

GPMP Toolbox

Scenario building and backcasting

Used in · Your 2050 vision

What it is

A proven method for future envisioning is scenario planning. Applying this method, a port constructs several possible futures, ranging from plausible to desired futures. They do not forecast, but ask the bigger “what if” questions to help them identify blind spots, stress-test their strategy and test assumptions against more than one vision of tomorrow.

To further utilize the outcome of the scenario planning, backcasting can be used. It is a method that starts from a future end point and works its way back to today to identify the required steps to reach the desired point. It is the mirror image of forecasting, which extrapolates forwards from today’s (and yesterday’s) trends. In terms of port decarbonization planning, backcasting helps ports identify where their investments and focus should be to achieve the climate goals set forward by the EU. Once the port has defined its desired 2050 outcome, it can work backwards to determine the actions needed to achieve long-term ambitions.

Read the full description ›
Prefer to read everything?

What you see above is the summary written for the web. The whole chapter for this step, with the complete detail, tables and annexes, is one single document.

Return
Scenario building and backcasting

What it is

A proven method for future envisioning is scenario planning. Applying this method, a port constructs several possible futures, ranging from plausible to desired futures. They do not forecast, but ask the bigger “what if” questions to help them identify blind spots, stress-test their strategy and test assumptions against more than one vision of tomorrow.

To further utilize the outcome of the scenario planning, backcasting can be used. It is a method that starts from a future end point and works its way back to today to identify the required steps to reach the desired point. It is the mirror image of forecasting, which extrapolates forwards from today’s (and yesterday’s) trends. In terms of port decarbonization planning, backcasting helps ports identify where their investments and focus should be to achieve the climate goals set forward by the EU. Once the port has defined its desired 2050 outcome, it can work backwards to determine the actions needed to achieve long-term ambitions.

Both the scenario planning and backcasting methods can be qualitative (i.e. narrative scenario describing actors, dynamics and storylines) or quantitative (i.e. key performance indicators and their possible evolutions). The most reliable work combines the two: narrative supplies meaning and direction; numbers supply testability. There is no single correct method. Ports must decide for themselves which method they follow and how they can integrate it into their decarbonization strategy. The right choice depends on a port’s starting point, the available data, and the questions it wants answered.

The four PIONEERS ports adopted different future envisioning approaches based on their specific context, strategic needs, and available data and methods. PoAB used an exploratory 2×2 scenario matrix to envision 4 climate-neutral futures and stress-test their existing decarbonization strategy. PoB combined a normative Cross-Impact Balance methodology with quantitative energy modelling to develop coherent scenarios and assess future energy pathways to 2050. PoV integrated regional port-flow scenarios with national macroeconomic scenarios. Constanța took a more pragmatic approach, developing three implementation scenarios that applied the same decarbonization measures at different speeds, allowing it to assess phased transition pathways rather than explore fundamentally different futures.

Reviewing the masterplans of the four PIONEERS ports, there are two routes for scenario planning. First, you can opt for ready-made scenarios. The PIONEERS desired future scenarios developed by PoAB are generic by design: any port can pick them up and start their own vision building, scenario planning and backcasting exercises to create their roadmap or stress test their current strategy. The other option is to build port-specific scenarios, as the ports of Barcelona and Venlo did. These are at least as valuable and effective, often richer because they are grounded in your own port system with all its characteristics and specifics. You can choose this route if you can afford the additional development cost and effort. Naturally, you can also use the ready-made scenarios as a starting point or inspiration for your own scenario development.

Return
Best-practice example

Port of Antwerp-Bruges: Green Ports in 2050

Port of Antwerp-Bruges developed 4 desired future scenarios for climate-neutral and economically competitive ports in 2050. These “protopian” futures were built to be ambitious enough to drive change, realistic enough to stay credible, and specific enough to guide concrete action. Protopian matters here: dystopian scenarios create paralysis and utopian ones invite dismissal.


What the scenarios are

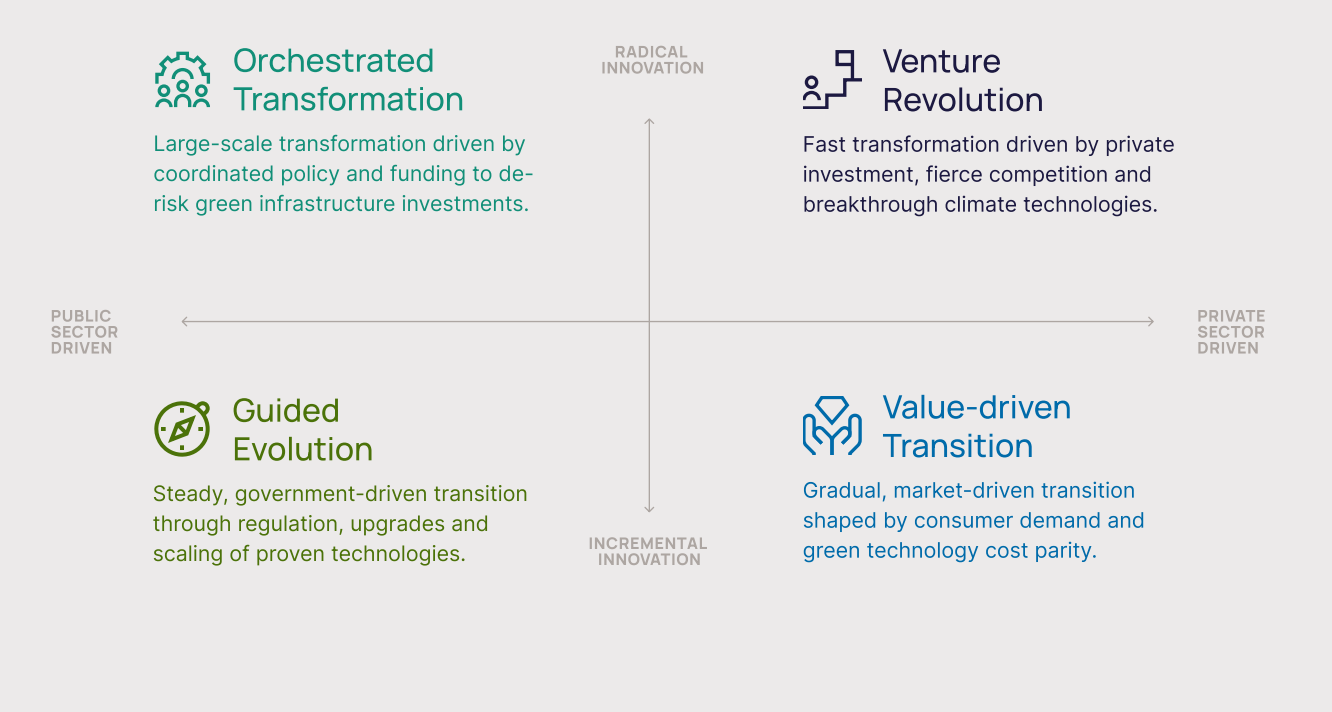
The scenarios were constructed using two questions:

  • Who drives change? The public sector or the private sector.
  • How fast does change happen? Through radical or incremental innovation.

These dimensions were the starting point to build the scenarios. These drivers were judged to have the greatest impact on the greening of ports, with the greatest uncertainty on how they will pan out in the future. Crossing these axes yields four climate-neutral futures for 2050. The destination is the same, the highways differ:

  • Orchestrated Transformation (public-radical): large-scale transformation driven by coordinated policy and funding to de-risk green infrastructure investment.
  • Venture Revolution (private-radical): fast transformation driven by private investment, fierce competition and breakthrough climate technologies.
  • Guided Evolution (public-incremental): steady, government-driven transition through regulation, upgrades and the scaling of proven technologies.
  • Value-driven Transition (private-incremental): gradual, market-driven transition shaped by consumer demand and green technology cost parity.

The real road to climate-neutrality will not be any of these extremes. It will land somewhere in between, combining the scenarios. Behind the four futures sit 100+ signals already visible in Europe, connecting the foresight to real developments in technology, governance and society.

Port of Antwerp-Bruges: Green Ports in 2050
Click to enlarge
How Port of Antwerp-Bruges used the scenarios

Port of Antwerp-Bruges used these scenarios in a backcasting workshop. Participants received the future scenarios and were divided into groups, each focusing on one of the four scenarios. They discussed, in their smaller groups, whether the port is already moving towards that future, whether it is desirable, what it would mean for the port ecosystem, and which drivers and barriers could either drive or impede them from reaching that climate-neutral port future by 2050. Afterwards, Each group identified several key milestones and the initiatives required over the next 5, 10 and 25 years to make their respective future scenario a reality. Comparing the outcomes across scenarios helped reveal actions that remain valuable under multiple futures and prioritise robust initiatives. Comparing the overall outcomes of the workshop with the current strategy helped stress-test the current decarbonisation strategy and identify which direction their current investments are taking them.

Return
Best-practice example

Port of Venlo

The PoV demonstrates how scenario development and backcasting can be integrated into the GPMP as complementary planning tools. Scenario development explores alternative pathways towards the future, while backcasting translates a desired long-term vision into practical implementation steps. Together, they provide a structured methodology for dealing with uncertainty while maintaining a clear direction towards climate neutrality.

The PoV developed its scenarios using the common methodology established within the PIONEERS project. Specifically, the PoV adapted existing frameworks to the regional context by not developing scenarios from scratch but by combined two well-established scenario frameworks and translating them to the inland logistics context.

The first framework consists of the Port of Rotterdam scenarios. Because Venlo functions as one of the principal inland logistics hubs within Rotterdam’s hinterland network, developments affecting Rotterdam have direct implications for freight volumes, modal split and energy infrastructure in Venlo. The four Rotterdam scenarios, Connected Deep Green, Regional Well-Being, Protective Markets and Wake-Up Call, were therefore adapted to reflect the characteristics of inland logistics and multimodal freight transport.

The second framework consists of the PBL WLO II scenarios, the official long-term socio-economic scenarios used by the Dutch Government. These scenarios provide nationally recognised assumptions regarding economic growth, demographic developments, technological progress and environmental policy, ensuring that the GPMP remains aligned with national planning instruments and infrastructure models.

By combining sector-specific logistics scenarios with nationally recognised socio-economic scenarios, the PoV created a coherent planning framework that links national economic developments with regional freight transport and logistics transitions. This demonstrates an important lesson for other ports: robust scenario development can often be achieved by adapting existing, high-quality scenario frameworks rather than creating entirely new scenarios.

In addition, rather than functioning as a standalone study, scenario development became an integral component of the GPMP. The scenarios provided the foundation for the Strategic Roadmap.

The close integration of scenario development with stakeholder engagement further strengthened the process. Stakeholders assessed the plausibility of the scenarios, discussed their implications for the regional logistics system and validated the strategic priorities identified through the analysis. This iterative process ensured that the final roadmap reflected both evidence-based foresight and practical operational knowledge.


From Alternative Futures to Robust Strategies

A distinguishing feature of the Port of Venlo methodology is that the scenarios were not developed as an academic foresight exercise but as a practical decision-support tool. Each scenario was analysed to assess its implications for freight transport, multimodal logistics, renewable energy systems, industrial development and port infrastructure. Rather than identifying projects that would only be successful under one specific future, the analysis focused on identifying measures that perform well across multiple scenarios.

Across all four scenarios, several strategic priorities consistently emerged:

  • decarbonisation of logistics and terminal operations;
  • expansion of renewable energy generation and storage;
  • increased use of rail and inland waterways;
  • development of circular industrial activities;
  • digital integration of logistics and energy systems; and
  • strengthened governance and regional collaboration.

These common priorities formed the strategic foundation of the GPMP because they contribute to climate neutrality regardless of which future ultimately develops. This approach increases the resilience of investment decisions and reduces the risk of stranded assets.


Backcasting: Connecting Vision with Implementation

While the scenarios explore different possible futures, backcasting provides the implementation pathway towards the preferred future. Starting from the objective of achieving a climate-neutral Port of Venlo by 2050, the project worked backwards to identify the actions, investments and governance arrangements required to reach this ambition. Rather than asking what is most likely to happen, backcasting identifies what must happen for the desired future to become achievable. The resulting implementation pathway defines progressive milestones for 2026, 2030, 2040 and 2050. The first milestone focuses on pilot projects, stakeholder mobilisation and establishing monitoring systems. The second phase emphasises modal shift, renewable energy generation and regional cooperation. By 2040, the emphasis shifts towards integrated renewable energy systems, hydrogen infrastructure and digitally optimised logistics. By 2050, these developments collectively enable climate-neutral operations supported by circular industrial activities and adaptive governance. This staged approach ensures that short-term investments remain aligned with the long-term vision while allowing sufficient flexibility to respond to technological, economic and policy developments.


Key Lessons from the Port of Venlo

The PoV demonstrates that effective scenario development extends beyond exploring alternative futures. Its strength lies in combining recognised scenario frameworks, adapting them to the regional context and translating them into robust strategic priorities through backcasting. The methodology shows how ports can build on existing national and sectoral foresight frameworks rather than developing entirely new scenarios, ensuring consistency with wider policy objectives while reducing analytical effort. By integrating scenario development with stakeholder engagement, innovation assessment and implementation planning, the PoV created a GPMP that is both strategically robust and practically implementable. For other inland and maritime ports, this approach provides a transferable methodology for managing uncertainty, aligning short-term decisions with long-term ambitions and developing resilient transition pathways towards climate neutrality.

Return
Best-practice example

Port of Barcelona

  • 1. Scenario building in the Port of Barcelona Green Port Master Plan

Scenario building is useful for dealing with uncertainty; in this case, Barcelona used it as a practical strategy-design tool rather than as a forecasting exercise. The exercise developed normative transition pathways: it did not ask which future was most likely, but how the port could achieve its long-term decarbonisation objectives under different external conditions. This distinction was important because the Green Port Master Plan needed to identify robust priorities, not only describe desirable futures.

The Barcelona approach also sat between a fully qualitative exercise and techno-economic model. Stakeholder knowledge and expert judgement shaped the scenarios, while a simplified backcasting and energy projection helped translate each scenario into implications for energy demand, infrastructure and strategic action.

  • 2. How Barcelona applied the method

The value of the process came from converting a complex port transition challenge into a structured discussion. Instead of presenting a generic list of technologies, the port first analysed its own system and then tested how different strategies behaved under changing external conditions.

1. Defining the purpose of the exercise. POB already had a clear decarbonisation direction. The scenario exercise therefore did not aim to predict the most likely future, but to explore alternative ways of reaching that direction under different external conditions. This made the scenarios directly useful for strategic planning, as each pathway tested a different combination of dominant strategies, such as sustainable fuels, electrification, carbon circularity, or regionalised supply chains.

2. Translating evidence into descriptors. The method converted the evidence base into a limited set of factors that could shape the transition. Interviews, surveys, workshops, SWOT analysis, activity mapping, and energy/GHG inventory were used to identify these factors. They were then simplified into descriptors such as regulatory ambition, energy security, technology development, social acceptance, data rules, safety rules, investment conditions, and willingness to pay a green premium.

3. Establishing influence between descriptors. For each pair of descriptor states, the exercise assessed whether one state made another more likely, less likely, or had no relevant effect. These relations were treated as structured expert judgement rather than statistical correlation. The assessment drew on stakeholder interviews, survey findings, literature review, and the port characterisation work. Each relation was then translated into a qualitative score, from strongly negative to strongly positive. For example, strong climate-policy ambition may reinforce willingness to pay a green premium and large-scale electrification, while restrictive data rules may weaken operational optimisation.

4. Testing internal coherence with CIB. The Cross-Impact Balance matrix made the assumptions explicit and allowed the scenario tool to test whether each combination of descriptor states was internally coherent. Combinations with conflicting assumptions were discarded, while mutually reinforcing combinations were retained. This helped reduce the risk of producing narratives that sound plausible but combine conditions that do not fit well together.

5. Using the scenarios for strategy design. The resulting pathways allowed the port to compare the robustness of electrification, sustainable fuels, energy efficiency, operational optimisation, intermodality and circular economy across different futures. They also helped identify when infrastructure, regulation, funding and stakeholder coordination would become critical. In this sense, the scenarios acted as a bridge between uncertainty analysis and practical decision-making.

  • 3. Example output: four normative transition pathways

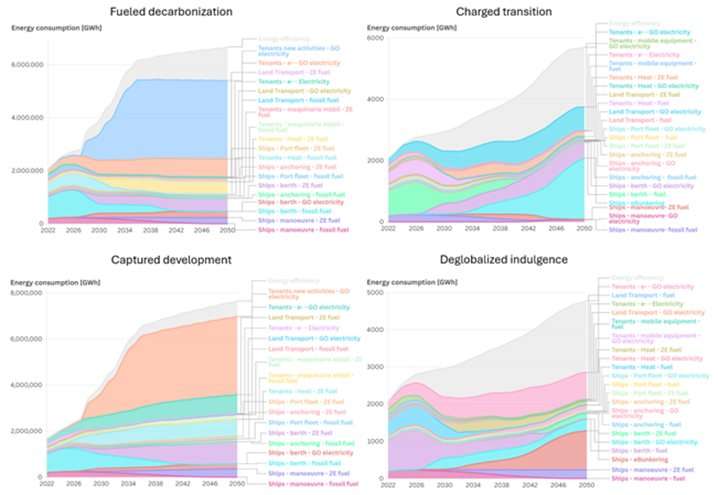
Barcelona selected four most coherent scenarios. Each pathway assumes that the port moves towards decarbonisation, but the dominant strategies and infrastructure needs differ. This helps other ports understand why a scenario exercise should not end with narratives only: it should also reveal what each future implies for decisions today.

Fueled decarbonisationCharged transitionCaptured developmentDeglobalised indulgence
Alternative fuels become the main route for transport and maritime uses. Efficiency and optimisation reduce exposure to higher energy costs.Renewable electricity, storage and smart-grid management drive large-scale electrification. Rail, short sea shipping and flexible operations become central.Carbon capture and CO2 logistics become central. Sustainable fuels develop through carbon valorisation while electrification remains limited.A fragmented world prioritises resilience and competitiveness. Electricity supports stationary uses and regional transport; intermodality increases for shorter supply chains.

These scenarios were then translated into energy projections that achieve the GHG reduction targets, presenting how the energy supply and consumption should evolve.

four normative transition pathways
Click to enlarge
  • 4. Considerations for replication

Do not start with the scenario names. Start with the port system: activities, energy uses, stakeholders, governance limits, infrastructure constraints and current emissions.

Make assumptions explicit. The main benefit of the method is transparency. Ports can see which policies, technologies or social conditions make each strategy stronger or weaker.

Use structure to improve discussion. The CIB matrix gives discipline to expert judgement. It does not replace stakeholder dialogue, but it helps organise it and test the internal consistency of the results.

Move from scenarios to decisions. Backcasting links each pathway to actions: grid reinforcement, fuel value chains, OPS deployment, rail and short sea shipping, CO2 logistics, incentives or cooperation agreements.

Use scenarios to find robust priorities. Strategies that remain useful across several pathways deserve early attention. Strategies that depend on one future require monitoring, partnerships or staged investment decisions.

Return
Your port today

Characterise your port ecosystem and its stakeholders

The characterisation of your port includes several attributes including geographical location, size, functions, governance structure, available infrastructure, and local ecosystems. Starting with the in-depth description of your port characteristics helps you in reflecting your starting point and provides you with relevant context for the next steps.


Why stakeholder engagement matters

One of the most important parts of your port ecosystem are your stakeholders. A GPMP cannot be developed by the port authority alone. The PIONEERS ports are experienced the need to collaborate and co-create the GPMP with their stakeholders in different ways: PoAB found that greening had to be embedded into existing organisational structure of the port rather than run as a separate project, PoV, as a municipality-governed inland port, depended entirely on business and regional cooperation to make its Roadmap implementable for all.

Stakeholder engagement is a process that depends on the availability, effort and collaboration of many interested parties. It is not a singular, uni-directional process. This approach will turn the greening vision of the actual GPMP from a technical document into a shared by all transition framework. Practically, the stakeholder engagement helped PIONEERS ports to:

  • Understand real needs, barriers and limits across the port ecosystem, and test whether proposed measures for greening are feasible;
  • Connect the GPMP with real operations, investment plans and available funding;
  • Align the GPMP with policy, regulation and infrastructure requirements;
  • Build trust and shared ownership with those who will help deliver it;
  • Create the building blocks for new governance models.
  • Stakeholder engagement across GPMP development phases

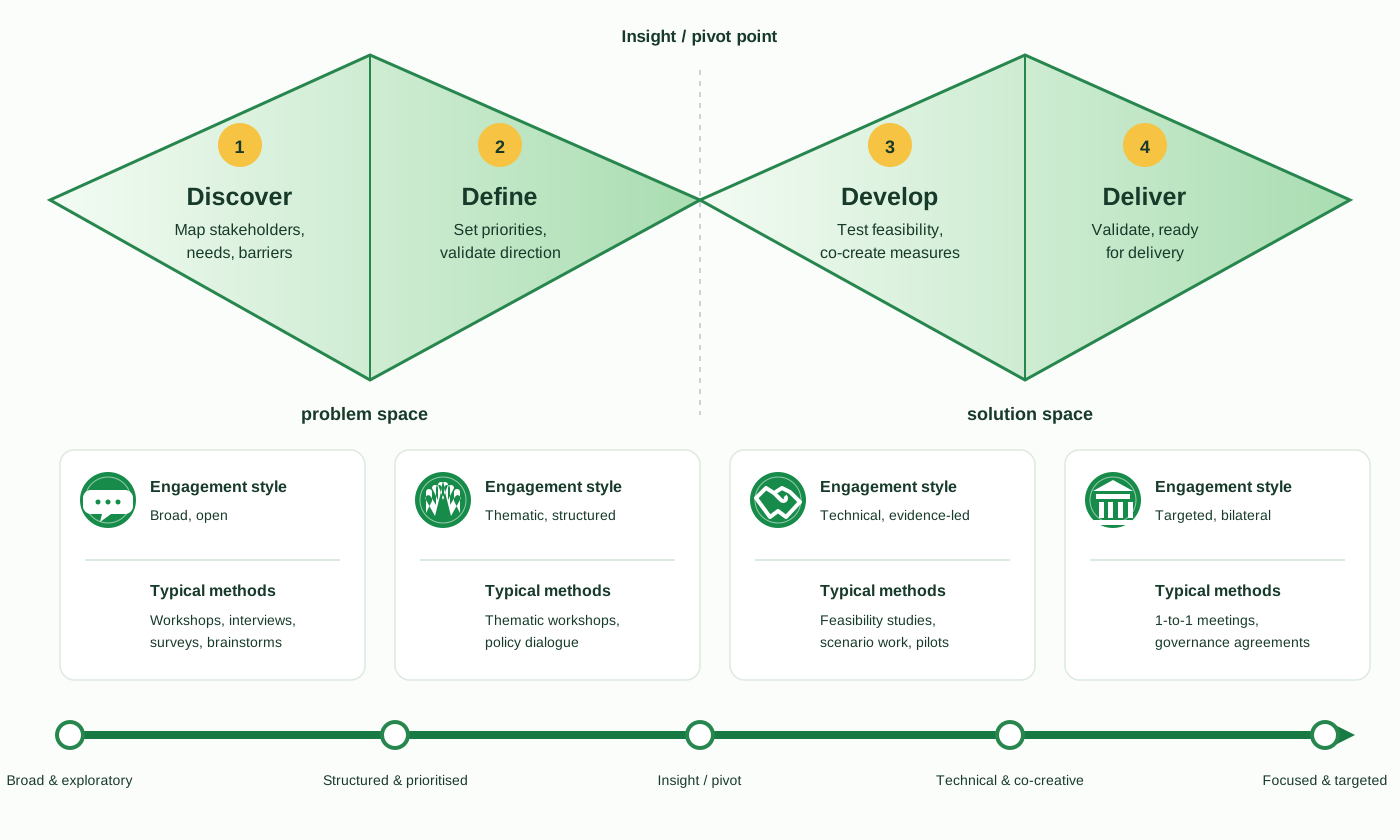
Stakeholder engagement should follow the GPMP development. The PIONEERS ports experience shows that the engagement type in the early GPMP development stages is different from the final GPMP development stages. At the beginning, ports need a broad stakeholder mapping and an open dialogue, as a method. Later, they need more focused cooperation with the stakeholders who can support the GPMP implementation. The figure below shows how stakeholder engagement shifts across the four phases of the GPMP development. From discovering the main focus of the GPMP and its agreement with the stakeholders to the finalisation of the GPMP, the stakeholder engagement process is a thread through all the activities carries out in ports to green their activities (see the table below). Bringing stakeholders together to embrace the greening principles in their activities, irrespective of their nature it is an activity that ports need investing in it.

The Discover-Define-Develop-Deliver Diagram (source- EIP own development)
Click to enlarge

Table 1 Approach for stakeholder engagement

PhaseKey questionDoAvoid
DiscoverWho matters and why?Extensive mapping, open interviews, brainstorming sessions with internal teams and known external actorsLocking in a fixed stakeholder list too early
DefineWhat should the GPMP prioritise?Thematic workshops, policy dialogue, first validation of directionMissing contribution and/or validation from major stakeholders to save time
DevelopWill this actually work?Feasibility studies, scenario testing, pilot discussions, co-creation workshopsRelying only on group workshops for sensitive topics
DeliverAre we ready to act?Targeted 1-to-1 meetings, governance agreements, roadmap approvalTreating delivery as the end of engagement
  • Stakeholder groups

The PIONEERS ports used a five-group structure to classify and track stakeholders. This structure helped PIONEERS ports to assess who was engaged when, and in which role. The engagement tracking eases the planning of tailored engagement activities for each group. In PIONEERS, businesses & operators are the largest and most operationally relevant group in every port, while communities & local neighbourhoods remained the least engaged group across all four PIONEERS ports. This gap was acknowledged by the ports and marks an important lesson learned to equally engage the different target groups, depending on the individual port context.

If you would like to start the stakeholder engagement process, please have a look into the Stakeholder groups and methods of engagement in our PIONEERS GPMP toolbox.

Classification of stakeholders

GroupUsual membersMain contribution
Internal stakeholdersPort authority, port management, departments (sustainability, finance, procurement, legal, IT)Institutional continuity, budget, data, implementation capacity
Legislation & public policyEU/national/regional/local authorities, ministries, regulatorsLegitimacy, funding access, regulatory alignment
Businesses & operatorsTerminal operators, shipping lines, logistics companies, energy/fuel suppliers, industrial tenantsOperational feasibility, investment, emissions reduction
Communities & local neighbourhoodsResidents, local NGOs, community groups, mediaSocial acceptance, local legitimacy
Education & researchUniversities, research institutes, training bodiesEvidence, innovation, technical validation


  • Mapping stakeholders

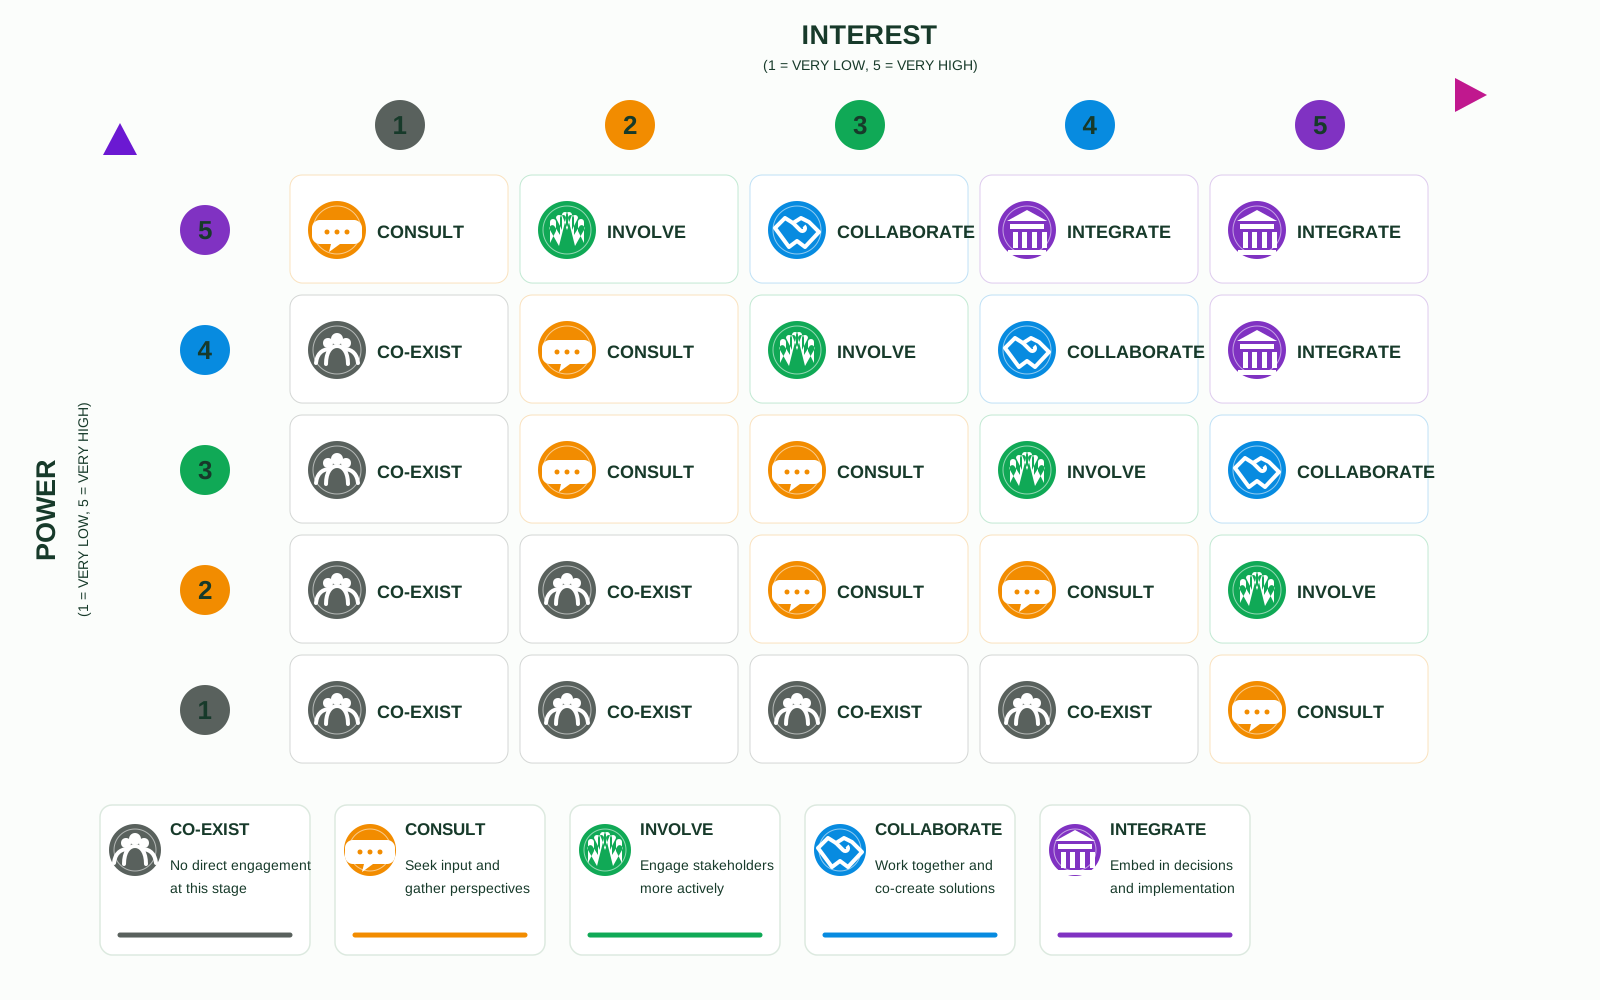
PIONEERS ports managed the stakeholder activity and assessed their role and importance in the GPMP process since 2022. The exercise reveals that power and interest of the stakeholders was changing: Internal and business stakeholders changed clearly their interest and role between the Discover and Deliver phases in every port, indicating the value of a continuous engagement process. The continuous stakeholder monitoring helps the ports to decide who and how to engage based on their power and interest in GPMP mapping, visualised on a heatmap (see the figure below). The stakeholder position on the heatmap helps to better define the engagement strategy with the respective stakeholder. Each combination of power and interest fed directly into one of the five engagement strategies, from Co-exist to Integrate.

Click to enlarge

Mapping the stakeholders and the strategies to engage them (source: EIP own design)

The Engagement strategies and sample engagement plan is a step-by-step procedure to map the stakeholders and to determine the engagement strategy and it is available for you in our GPMP-toolbox.

  • Stakeholder Engagement methods

Each of the PIONEERS ports used a mix of engagement methods, depending on the GPMP development stage and the particular topic area. Broad formats, such as workshops or surveys were mainly chosen in the early phases, followed by co-creation and bilateral formats as the GPMP process further developed. Main methods used in PIONEERS ports are presented in the table below.

Methods applied by PIONEERS ports for stakeholder engagement

MethodBest forWhen to use
Questionnaires, surveysBroad, quantifiable inputGood early evidence base, need to reach many actors
InterviewsSensitive or complex topicsUse when being in a group would limit openness
WorkshopsCo-creation, priority-setting, validationBest for Define and Develop phases
One-to-one, bilateral meetingsInvestment decisions, operational constraints, sensitive issuesEssential once the GPMP is closer to the delivery
Focus groupsIn-depth feedback from a defined groupUseful for testing draft measures
Hackathon, ideathonStudents, academia, internal teams, businesses, developersFresh ideas or prototypes for a specific problem, especially in the Develop phase
Conferences, public eventsDissemination, awareness, network-buildingNot for detailed negotiation


A comprehensive list of methods and communication channels is available for you in our GPMP-toolbox.

  • Engagement barriers and actions

Every PIONEERS port faced internal and external barriers during the stakeholder engagement process. For example, all four PIONEERS ports reported that the 2050 horizon of the GPMP felt too distant for businesses focused on daily operations. Translating the long-term goals into the short-term, concrete actions (pilots, infrastructure upgrades, funding calls) is a solution to cope with this barrier.

In general, internal barriers relate to the port authority’s own capacity, culture, organisation and way of working. External barriers relate to stakeholders, market conditions, policy uncertainty or the wider port ecosystem (see the table below). In PIONEERS we learned that the barrier identification should be made early because they affect the quality, timing and depth of GPMP engagement. An extensive barriers list identified with possible causes and possible mitigation actions is available in the GPMP toolbox. .

Barriers for engagement and mitigation solutions (examples of the most common ones)

TypeBarriersHow to overcome them
InternalWeak engagement culture, internal silos, uncoordinated outreach, capacity and/or data gaps, unclear use of stakeholder inputAssign clear ownership, create an internal GPMP coordination group, centralise outreach, build capacity or use external consultants for peak loads, log input and show how it shapes the GPMP.
ExternalLack of time/resources, wrong or missing stakeholder, long time horizon feels irrelevant, weak interest, lack of trust, cost concerns, technical and/or regulatory uncertaintyKeep requests concrete, translate the GPMP objectives into short-term action, link actions to concrete benefits and duties, be transparent about how stakeholder’s input is used, discuss funding and phasing early, involve regulators and use pilots and/or feasibility studies.

The engagement barriers show that the GPMP process needs better design. By acknowledging these barriers early, the ports will choose better methods for engagement, target the right stakeholders and turn engagement into a core part of the GPMP process.

Return
Your port today

Determine your current environmental footprint as a starting point

Purpose and scope

Ports need a clear greenhouse gas (GHG) footprint to understand where emissions occur, set priorities, and monitor progress towards decarbonisation. A port inventory should therefore do more than produce a reporting figure: it should support investment decisions, stakeholder dialogue, regulatory compliance, and the design of practical decarbonizing measures.

The main challenge is that ports are complex ecosystems. The port authority may own or control only a limited share of the activities that generate emissions, while ships, terminals, logistics operators, service providers, tenants, construction contractors, passengers, workers, and public authorities all influence the final footprint. For this reason, the inventory must clearly state its boundaries, data sources, assumptions, and level of influence over each emission source.


Inventory structure

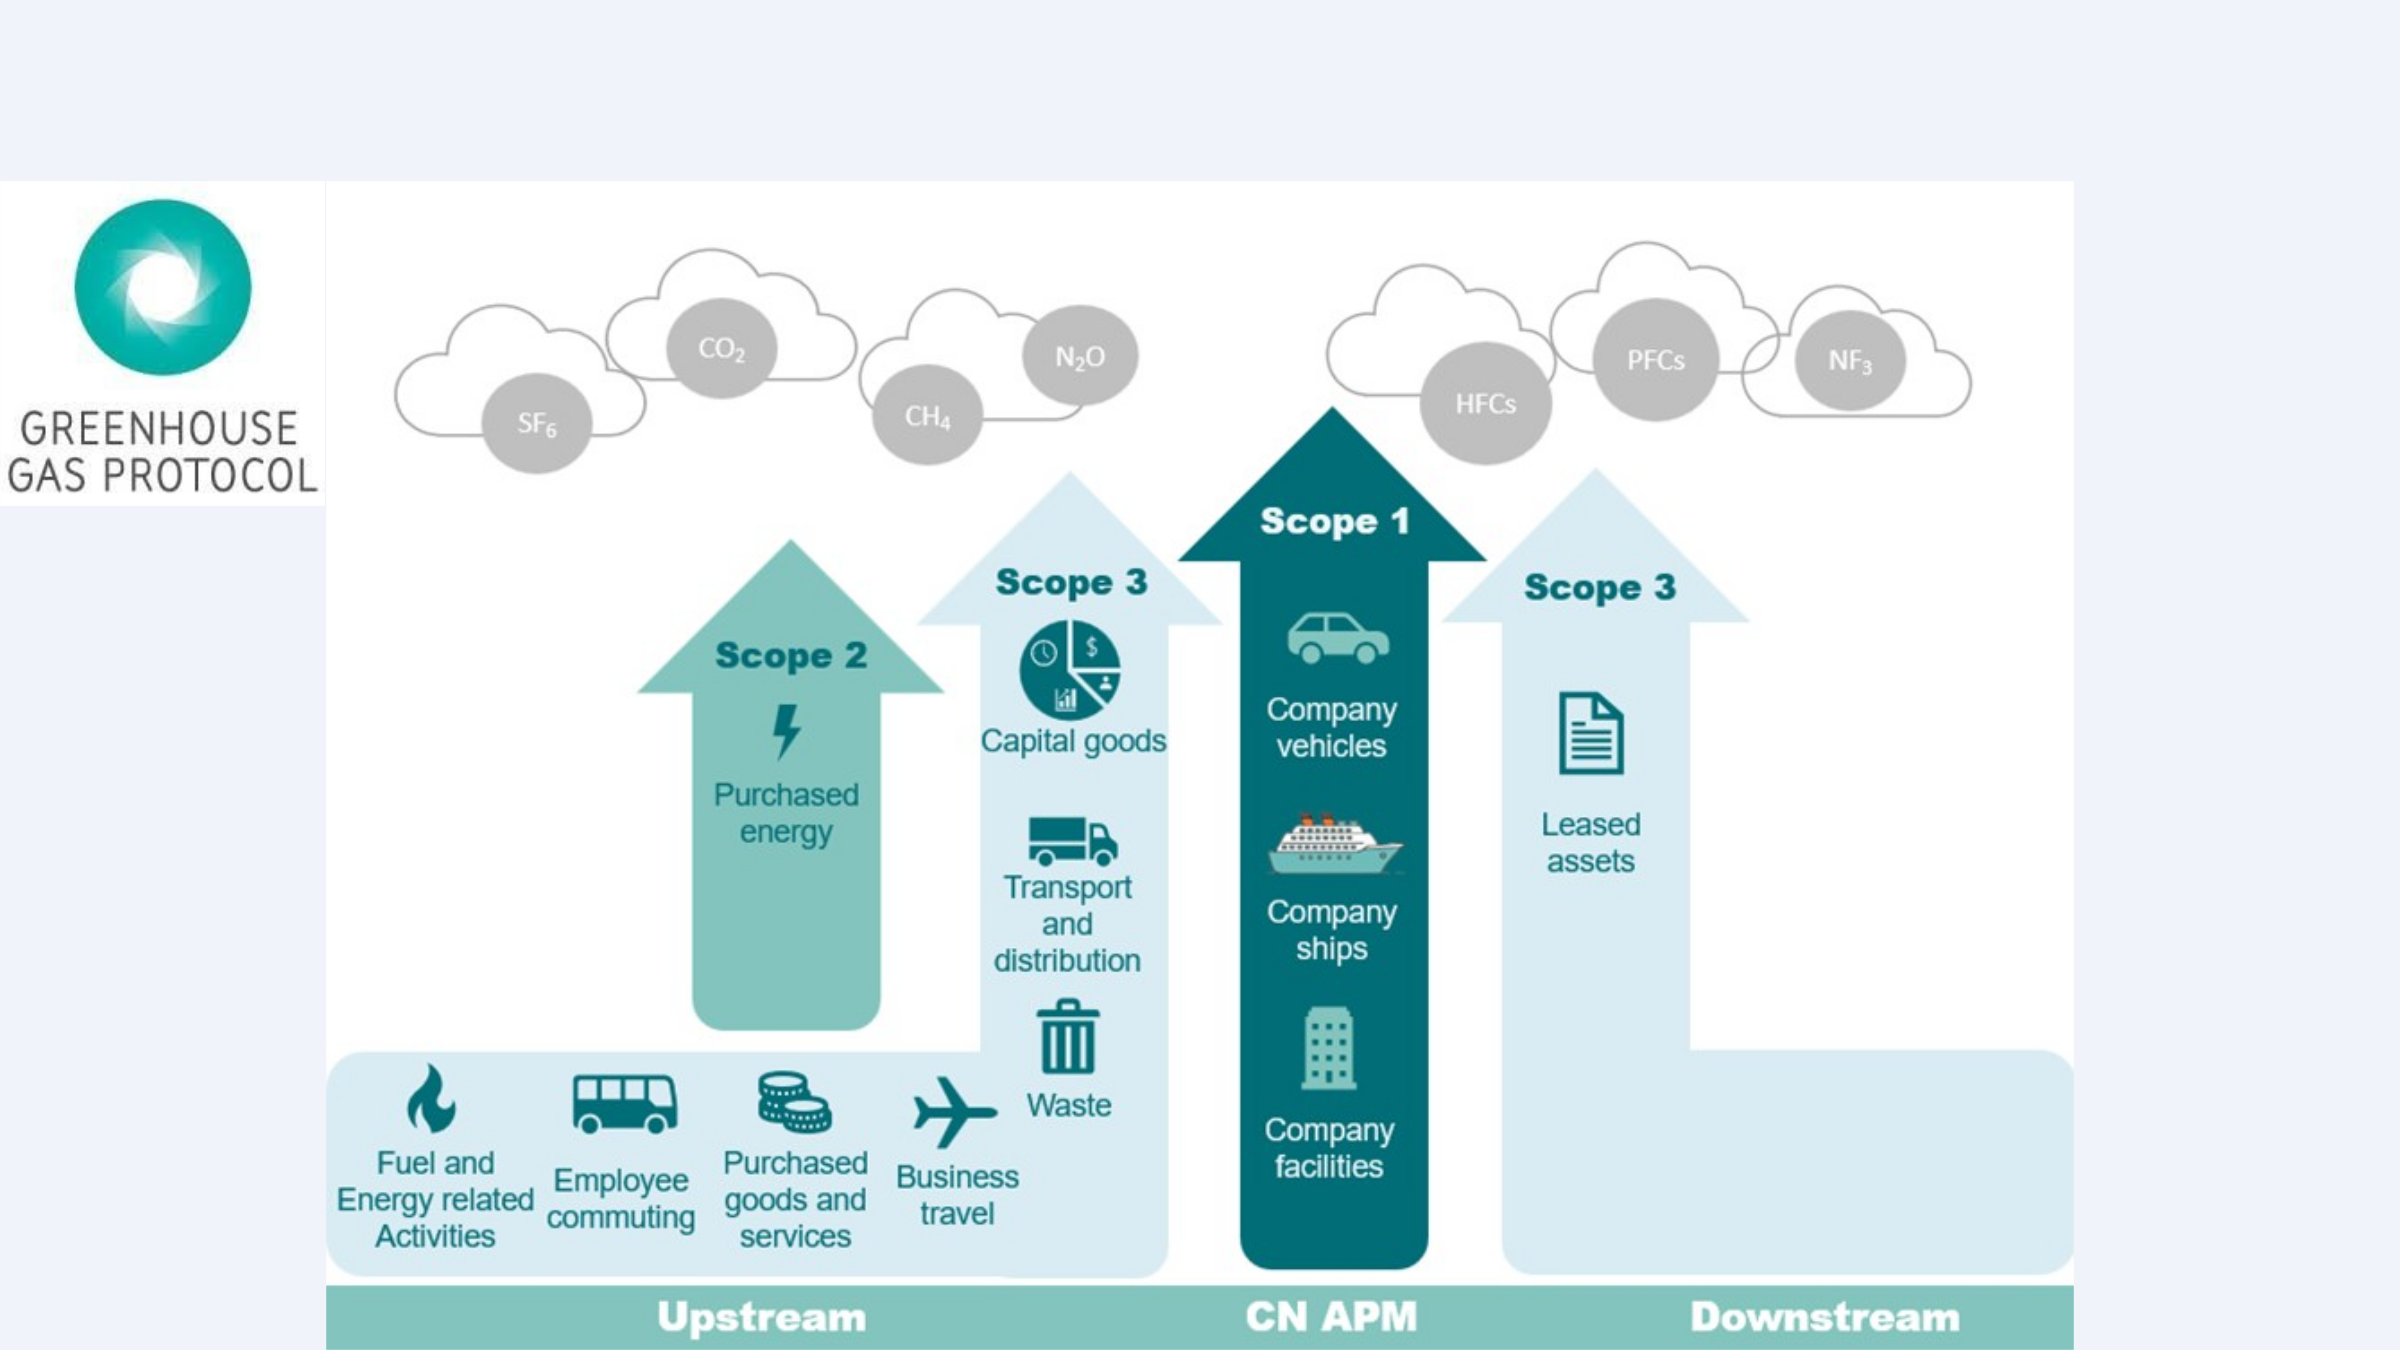
Most inventories follow recognised carbon accounting frameworks. The GHG Protocol classifies emissions as Scope 1, Scope 2 and Scope 3: direct emissions from owned or controlled sources, indirect emissions from purchased energy, and other indirect value-chain emissions. ISO 14064-1 provides a compatible organisation-level approach for quantifying and reporting GHG emissions and removals. Both frameworks rely on the same basic principles: relevance, completeness, consistency, transparency and accuracy.

For ports, defining inventory boundaries is a central challenge. A ship at berth, a terminal crane, a truck entering the gate or waste treated off site may be connected to the port area, but the port authority may not own, operate or directly control the activity. Ports should therefore avoid treating boundaries as a simple technical choice. They should explain which activities are included, why they are included, who controls or influences them, and where a geographical view of emissions in the port area complements the organisational inventory.


Main emission blocks

A practical port inventory can be organised around emission blocks rather than around departments. This helps readers understand the operational reality of the port and makes the inventory more useful for action planning.

Emission blockTypical sourcesKey data needs
ShipsAnchoring, navigation, manoeuvring and hotelling at berthPort calls, time in mode, vessel characteristics, fuel type and engine assumptions
Port servicesTugboats, pilots, bunkering barges and other marine servicesFuel use, engine hours, service records and manoeuvre data
Land transportTrucks, rail, worker mobility and passenger mobilityTrips, distances, vehicle types, cargo flows, surveys and gate or traffic data
Tenants and terminalsTerminal equipment, logistics operations, industrial activity and buildingsElectricity, fuels, refrigerants, equipment use and renewable generation
Construction and wasteMaterials, machinery, transport, waste collection and treatmentMaterial quantities, contractor reports, invoices, waste types and treatment routes
Data, methods and emission factors

The basic calculation is simple: activity data multiplied by an emission factor produces emissions expressed in tonnes of CO2 equivalent. In practice, the quality of the result depends on the quality of the activity data and the suitability of the emission factor. Fuel or electricity consumption data usually provides the most direct estimate. When this is not available, ports may need to use operational data such as distance travelled, time at berth, number of calls, tonnes handled, material quantities or survey results.

Ports should use emission factors that match the geography, year, technology and activity being assessed. International sources help maintain comparability, while local factors can improve accuracy for activities shaped by regional systems, such as electricity supply or waste treatment. The inventory should record the source and year of each factor, the greenhouse gases included, and any assumptions used to convert activity data into emissions.

Data governance is as important as the calculation method. Annual data requests, common templates, clear definitions, traceable records, validation checks and confidentiality arrangements help improve consistency. Digital data flows between port authorities, tenants and service providers can reduce manual work, limit errors and allow the inventory to become a management tool rather than a one-off reporting exercise.


  • Key messages and recommendations

Port GHG inventories are most useful when they are designed for decision-making. They should identify the main emission hotspots, clarify which actors can influence them, and connect the results to practical decarbonisation measures. A transparent inventory also supports dialogue with operators, customers, local communities, financial institutions and public authorities.

The main barriers are limited access to tenant data, inconsistent reporting formats, confidentiality concerns, lack of dedicated resources and the absence of a harmonised port-specific methodology.

  • Define the inventory boundary before collecting data, and explain whether it follows operational control, financial control, geography or a combined approach.
  • Map stakeholders early and identify who generates emissions, who holds data and who can influence reductions.
  • Use recognised accounting principles and document assumptions, exclusions and uncertainty.
  • Prioritise high-impact emission blocks such as ships, terminals, land transport, construction and energy use.
  • Develop common templates, validation procedures and digital tools to improve data quality over time.
  • Use the footprint to engage with stakeholders and motivate new initiatives.
Return
Your port today

Understanding the port ecosystem

Why should a port understand its ecosystem?

Problem exploration is the process of developing a deep understanding of a problem before attempting to solve it. In the context of port decarbonisation, this is essential: a port cannot decarbonise what it does not understand. The transition to a climate-neutral port rarely fails because of a lack of technological solutions; rather, it is slowed by the complex interdependencies between regulation, finance, technology, stakeholder interests, social acceptance, and governance. Stakeholders often hold different perspectives, root causes may be unclear, and important constraints may remain hidden. Without first understanding how these factors interact, ports risk addressing symptoms rather than the underlying causes of the challenges they face.

GPMP Toolbox

Practical methods for stakeholder engagement

Used in · Your port today

What it is

In the development of a GPMP, your port stakeholders play a key role. Stakeholder engagement is a collaborative process to involve an active participation of your stakeholders with mutual effort and cooperation. The following section provides you with a methodology for the stakeholder engagement process based on the experiences and lesson’s learned of the PIONEERS project.

To further utilize the outcome of the scenario planning, backcasting can be used. It is a method that starts from a future end point and works its way back to today to identify the required steps to reach the desired point. It is the mirror image of forecasting, which extrapolates forwards from today’s (and yesterday’s) trends. In terms of port decarbonization planning, backcasting helps ports identify where their investments and focus should be to achieve the climate goals set forward by the EU. Once the port has defined its desired 2050 outcome, it can work backwards to determine the actions needed to achieve long-term ambitions.

How to use it

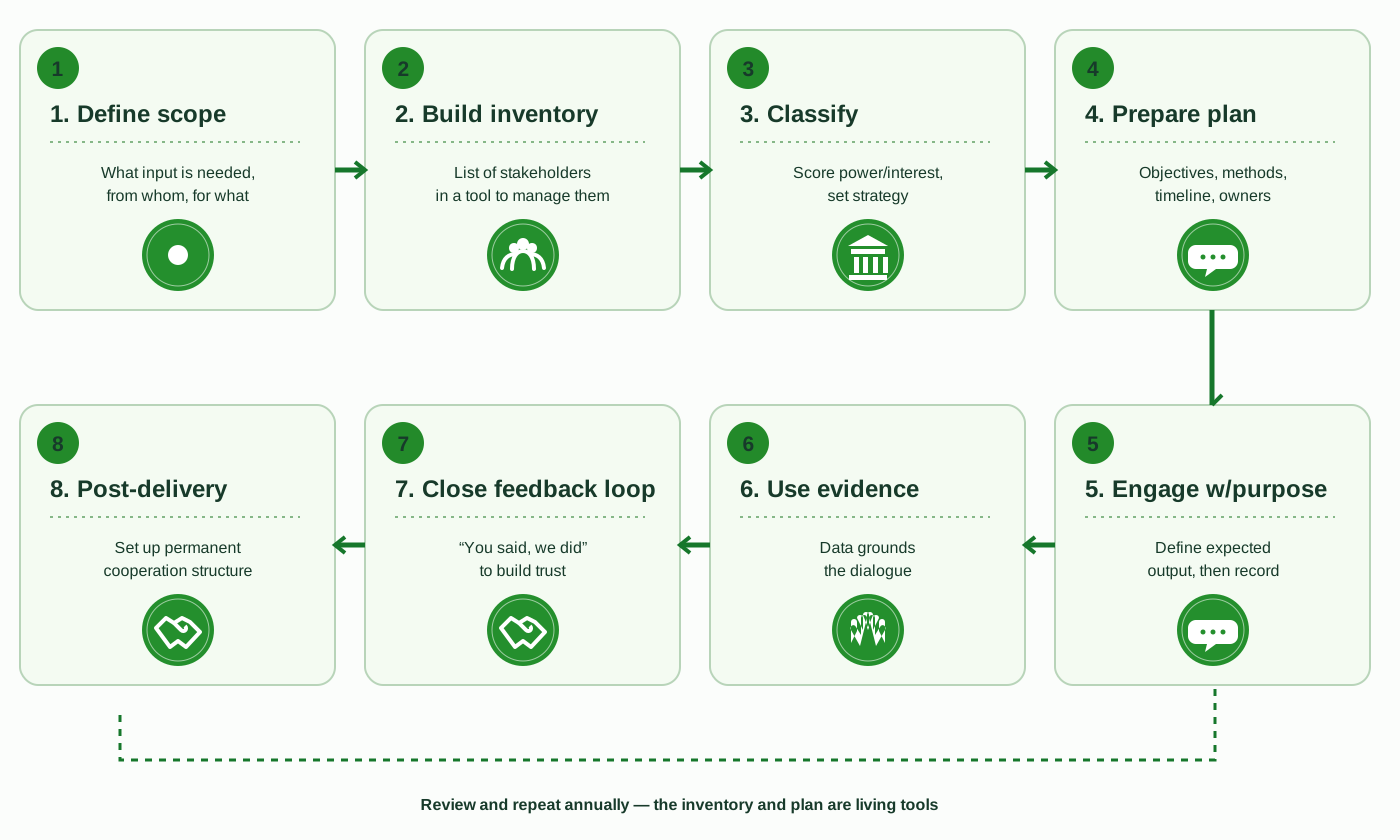
Step-by-step approach for stakeholder engagement – a practical “to do” list
Step 1: Define the engagement scope

Begin with defining what the GPMP aims to achieve, which time horizon it covers, which topics will be addressed and what kind of stakeholder input is needed. This framework guides the stakeholder mapping and helps ports identify the relevant stakeholder for each topic. This provides the stakeholder engagement process with a clear reference point. Clarify what are the stakeholder needs and how their inputs will be used in the GPMP development process. The input may include data, validation, support, funding, technical input, policy alignment or social acceptance. Questions:

Read the full method ›
Prefer to read everything?

What you see above is the summary written for the web. The whole chapter for this step, with the complete detail, tables and annexes, is one single document.

Return
Practical methods for stakeholder engagement

How to use it

Step-by-step approach for stakeholder engagement – a practical “to do” list
Step 1: Define the engagement scope

Begin with defining what the GPMP aims to achieve, which time horizon it covers, which topics will be addressed and what kind of stakeholder input is needed. This framework guides the stakeholder mapping and helps ports identify the relevant stakeholder for each topic. This provides the stakeholder engagement process with a clear reference point. Clarify what are the stakeholder needs and how their inputs will be used in the GPMP development process. The input may include data, validation, support, funding, technical input, policy alignment or social acceptance. Questions:

  • What is the main goal, time horizon and the approach for GPMP elaboration?
  • Which topics or decisions require stakeholder input?
  • Which measures need external cooperation?
  • Which stakeholders may support or block implementation?
  • Which groups may be affected by the GPMP?
  • Clear objectives prevent waste of time. Every stakeholder contacted should be linked to a clear engagement need.
Step 2: Build the stakeholder inventory

Create a working file with all relevant stakeholders. Include:

  • Organisation name;
  • Contact person;
  • Stakeholder group and their type, e.g. Internal, Legislation & public policy, Businesses & operators, Communities & local neighbourhoods, Education & research;
  • GPMP pillars involved, e.g. Clean energy, Sustainable design, Modal shift, Digital transformation;
  • Dimension of influence, e.g. Political, Economic, Social, Technical, Operational, Environmental;
  • Power level;
  • Interest level;
  • Expected role (reason for engaging);
  • Engagement strategy;
  • Engagement barriers with this stakeholder and ways to address them;
  • Follow-up action.
  • Treat the inventory as a living tool. Update it after each interaction, such as meetings, surveys, workshops and major GPMP milestones. It is the basis for tracking how power and interest of a stakeholder shift as the GPMP process is implemented.
Step 3: Determine the engagement strategy

Classify stakeholders by power, interest and role in the GPMP process. This helps the port deciding how much effort to invest in the relationship with each of the stakeholders, and to decide which is the right engagement approach.

PIONEERS used a 5-phase engagement strategy, as presented in the Table xx below. This allowed the ports to better tailor the engagement activities for each of the GPMP process’ phases by using the right engagement method/tool in order to maximise the engagement of the relevant stakeholders:

Engagement strategy (phases)GoalWhen to use
Co-existKeep basic awarenessStakeholder has low role in the current phase
ConsultAsk for feedbackStakeholder can provide useful views
InvolveInclude stakeholders in selected activitiesStakeholder has relevant knowledge or interest
CollaborateWork jointly with stakeholders on measuresStakeholder can help shape or deliver actions
IntegrateInvolve stakeholders in the GPMP decision and create a new governance modelStakeholder is critical for implementation


  • Not all stakeholders need to be integrated. A mature GPMP uses different strategy for engagement for different actors.
Step 4: Prepare an engagement plan

The engagement plan should reflect who will be engaged, why, when and how. It should be realistic. A small port team should not plan more activities than it can manage.

The plan should include:

  • Objectives;
  • Target groups;
  • Strategy
  • Methods;
  • Timeline;
  • Internal responsibilities;
  • Expected outputs;
  • Communication channels;
  • Follow-up process;
  • Risks and mitigation actions.
Example of engagement activity plan
Engagement activity focusPlanned dateType of stakeholderEngagement strategyMethodStakeholders engagedExpected outcome
e.g. Draft GPMP validation workshopQ1Business & operator, Legislation & policy, InternalConsult / InvolveWorkshopTerminal operators, local authorities, internal teamFeedback on draft GPMP; barriers and opportunities identified
e.g. Energy transitionQ2Business & operatorCollaborate1-to-1 meetingEnergy providesClarify investment conditions


Recommendation: review and refresh the plan each year or quicker, cross-checking it against the master inventory (Annex 1, Step 2). The Engagement strategy column should match the stakeholder’s current position on the power/interest heatmap. If it doesn’t, this signals either the activity is over- or under-ambitious for that stakeholder, or the stakeholder’s assessment needs revision.

  • A written plan turns engagement from ad-hoc contact into a manageable, resourced activity.
Step 5: Engage meaningfully

Before each engagement activity define the expected output. This may be a validated priority, obtaining a list of barriers in developing the GPMP, a technical requirement, a data source, a funding need or a revised action. After each activity, record:

  • Who participated;
  • What was discussed;
  • What was agreed;
  • What concerns were raised;
  • What follow-up is needed;
  • How the GPMP should be altered/updated/improved.
  • Recording outputs is what turns individual meetings into a body of evidence for the GPMP.
Step 6: Use evidence to support dialogue

Stakeholders engage more actively when the GPMP is concrete. Ports should use data to support discussion. Useful evidence includes:

  • Carbon footprint baselines;
  • Energy demand studies;
  • Emissions inventories;
  • Mobility surveys;
  • Infrastructure assessments;
  • Cost estimates;
  • Feasibility studies;
  • Technology readiness checks;
  • Regulatory mapping;
  • Transferability assessments.
  • Evidence helps move the discussion from general ambition to practical choices.
Step 7: Close the feedback loop

Stakeholders need to see that their input matters. After each main engagement activity, the port should provide feedback. This could be done through:

  • Short meeting notes;
  • Summary emails;
  • Updated roadmap tables;
  • “You said, we did” summaries;
  • Public progress updates;
  • Revised action fiches.
  • Closing the feedback loop builds trust and reduces fatigue.
Step 8: Prepare post-delivery engagement

The GPMP process should not end with its formal approval. The GPMP implementation needs permanent or semi-permanent cooperation. Possible structures include:

  • A port community;
  • An interdepartmental GPMP group;
  • A stakeholder advisory board;
  • Technical working groups;
  • Annual stakeholder map updates;
  • A monitoring-reporting-verification cycle.
  • The stakeholder engagement should continue even after the GPMP has been defined, throughout its delivery (roadmap); this approach should be tailored to the size and the governance model of the port.
Stakeholder engagement workflow
Click to enlarge
GPMP Toolbox

Stakeholder groups and methods of engagement

Used in · Your port today

What it is

Use this list as a starting checklist during the Discover phase. It is not exhaustive, each port should add categories specific to its own context, but it prevents relevant groups from being missed.


1. Internal stakeholders

Usual members: Port authority, Port management, Employees, Trade unions, Shareholders, Board members, Harbourmaster

How to engage them:

  • Create an internal GPMP working group;
  • Clarify roles and decision rights;
  • Involve departments before external commitments are made;
  • Check whether the roadmap fits existing plans and budgets;
  • Use internal meetings to prepare common messages.
Read the full description ›
Prefer to read everything?

What you see above is the summary written for the web. The whole chapter for this step, with the complete detail, tables and annexes, is one single document.

Return
Stakeholder groups and methods of engagement

What it is

Use this list as a starting checklist during the Discover phase. It is not exhaustive, each port should add categories specific to its own context, but it prevents relevant groups from being missed.


1. Internal stakeholders

Usual members: Port authority, Port management, Employees, Trade unions, Shareholders, Board members, Harbourmaster

How to engage them:

  • Create an internal GPMP working group;
  • Clarify roles and decision rights;
  • Involve departments before external commitments are made;
  • Check whether the roadmap fits existing plans and budgets;
  • Use internal meetings to prepare common messages.
2. Legislation & public policy stakeholders

Usual members: European regulatory bodies, Ministries (transport/infrastructure, environment, etc.), Regional authorities, Local authorities, Neighbouring municipalities, Regional/local transport authority, Politicians and other decision-makers, Health & safety authorities, Customs

How to engage them:

  • Involve them early, not only at the end;
  • Clarify which measures depend on external approval;
  • Connect the GPMP with regional, national and EU policy;
  • Use policy dialogue to reduce future delays;
  • Keep a record of dependencies and decisions needed.
3. Businesses & operators

Usual members: Shipping companies, National/regional/local business associations (Chambers of commerce, professional associations), terminal operators, tail operators, targe operators, logistic operators, nautical service operators, Cargo handling operators, bunkering service providers, Trucking companies, Cruise lines, Industrial companies, towing service providers, public transport service providers, ICT and utility service providers, international business associations

How to engage them:

  • Start with mapping and interviews;
  • Use workshops for shared priorities;
  • Use bilateral meetings for sensitive topics;
  • Discuss costs, business cases and risks openly;
  • Link long-term goals to short-term operational benefits.
4. Communities & local neighbourhoods

Usual members: National/Local environmental NGOs, local authority forums, local community organisations, special interest groups, media, citizens, community groups, tourists and passengers, foundations

How to engage them:

  • Create simple and clear communication materials;
  • Explain local benefits and possible impacts;
  • Use public sessions, surveys and local forums;
  • Involve workers and local education bodies;
  • Keep community input visible in the GPMP process.
5. Education & research

Usual members: Universities, training & research institutions, Experts from other cities/ports

How to engage them:

  • Invite them to support baselines and studies;
  • Use them in ideation and validation sessions;
  • Involve them in monitoring and skills development;
  • Connect research outputs with practical port needs;
  • Avoid purely academic discussions without operational value.
  • A single organisation/entity may appear in more than one category over time (e.g. a local authority may act as a public policy stakeholder during the initial phases of the GPMP and later as a partner for mobility or community related measures). Update the category if the relationship changes.
GPMP Toolbox

Mapping stakeholders and engagement strategies

Used in · Your port today

What it is

How to determine the Power/Interest heatmap and engagement strategy
  1. List every stakeholder identified in the Discover phase.
  2. Assess the Power (1–5) and Interest (1–5) for each of the stakeholders. Use the level definition below.
  3. Locate the cell on the heatmap. The cell represents the engagement strategy: Co-exist → Consult → Involve → Collaborate → Integrate.
  4. Revise the assessment at least once a year, or quicker if necessary. Power and Interest shift as the GPMP moves from planning to delivery. In practice, PIONEERS ports experienced internal and business stakeholders’ scores change significantly between the Discover and Deliver phases.
  5. Use the strategy as a default, not a maximum. A stakeholder can be deliberately engaged more intensively than their assessment suggested initially, if their cooperation is critical to a specific measure or phase in the process.
Read the full description ›
Prefer to read everything?

What you see above is the summary written for the web. The whole chapter for this step, with the complete detail, tables and annexes, is one single document.

Return
Mapping stakeholders and engagement strategies

What it is

How to determine the Power/Interest heatmap and engagement strategy
  1. List every stakeholder identified in the Discover phase.
  2. Assess the Power (1–5) and Interest (1–5) for each of the stakeholders. Use the level definition below.
  3. Locate the cell on the heatmap. The cell represents the engagement strategy: Co-exist → Consult → Involve → Collaborate → Integrate.
  4. Revise the assessment at least once a year, or quicker if necessary. Power and Interest shift as the GPMP moves from planning to delivery. In practice, PIONEERS ports experienced internal and business stakeholders’ scores change significantly between the Discover and Deliver phases.
  5. Use the strategy as a default, not a maximum. A stakeholder can be deliberately engaged more intensively than their assessment suggested initially, if their cooperation is critical to a specific measure or phase in the process.
1. Power levels (1–5)
ScoreLevelDefinition
5Very highCan direct or have a major impact on the GPMP
4HighCan significantly affect the GPMP’s scope, schedule or budget
3ModerateCan have a minor impact on the GPMP
2LowCannot directly impact the GPMP, but may have access to someone who can
1Very lowCannot directly impact the GPMP


2. Interest levels (1–5)
ScoreLevelDefinition
5Very highStrong interest in the GPMP’s success and outcomes
4HighHighly supportive of the GPMP and its benefits
3ModerateSees a benefit in the GPMP
2LowSees some harm from the GPMP, would prefer it stopped
1Very lowBelieves the GPMP’s costs are greater than its benefits


3. Engagement strategy goals
StrategyGoalWhen to use
Co-existKeep the stakeholder informed to help them understand the processThe stakeholder has a limited role in the current phase
ConsultObtain the stakeholder’s feedback on relevant planning decisionsThe stakeholder can provide useful views
InvolveRely on the stakeholder’s advice when making planning decisionsThe stakeholder has relevant knowledge, interest or influence
CollaborateWork jointly with the stakeholder to design solutions and recommendationsThe stakeholder can help shape or deliver actions
IntegrateEmbed the stakeholder’s ideas, experience and proposals directly in the GPMPThe stakeholder is critical for implementation
  • Assess each stakeholder on both dimensions. An incomplete assessment leads to a wrong engagement strategy.
  • Re-assess annually or any time when the GPMP moves from one phase to another.
GPMP Toolbox

Engagement methods and communication channels

Used in · Your port today

What it is

1. Methods
MethodAudienceBest used for
QuestionnaireBusinesses, NGOs, public bodies, citizensBroad, quantifiable input at low cost
Needs surveyBusinesses, citizens, NGOsIdentifying areas of interest for follow-up
InterviewPublic bodies, businessesIn-depth or sensitive topics needing individual input
Focus groupBusinesses, NGOs, public bodiesDetailed feedback from a small, defined group
Online shared whiteboardKey/high-influence stakeholdersRemote visual co-creation
Collaborative researchAcademia, research centres, public bodiesEmbedding stakeholders directly in analysis
Creative labKey/high-influence stakeholdersExploring new solutions jointly
Think tankAcademia, public bodiesHigh-level policy advice
WorkshopBusinesses, NGOs, public bodiesCo-creation, problem-solving, validation
Hackathon / ideathonStudents, academia, internal teams, businesses, developersFast, intensive co-creation of concrete ideas or prototypes for a specific problem engages younger/technical audiences and brings new thinking to the GPMP process.
Public meetingBusinesses, citizens, NGOs, public bodiesWide awareness-raising, transparency
1-to-1, bilateral meetingAny, especially business/investment actorsSensitive, commercial or investment-related discussion
Site visit, knowledge exchangeAnyDiscussion based on practice in operational reality, peer learning


Read the full description ›
Prefer to read everything?

What you see above is the summary written for the web. The whole chapter for this step, with the complete detail, tables and annexes, is one single document.

Return
Engagement methods and communication channels

What it is

1. Methods
MethodAudienceBest used for
QuestionnaireBusinesses, NGOs, public bodies, citizensBroad, quantifiable input at low cost
Needs surveyBusinesses, citizens, NGOsIdentifying areas of interest for follow-up
InterviewPublic bodies, businessesIn-depth or sensitive topics needing individual input
Focus groupBusinesses, NGOs, public bodiesDetailed feedback from a small, defined group
Online shared whiteboardKey/high-influence stakeholdersRemote visual co-creation
Collaborative researchAcademia, research centres, public bodiesEmbedding stakeholders directly in analysis
Creative labKey/high-influence stakeholdersExploring new solutions jointly
Think tankAcademia, public bodiesHigh-level policy advice
WorkshopBusinesses, NGOs, public bodiesCo-creation, problem-solving, validation
Hackathon / ideathonStudents, academia, internal teams, businesses, developersFast, intensive co-creation of concrete ideas or prototypes for a specific problem engages younger/technical audiences and brings new thinking to the GPMP process.
Public meetingBusinesses, citizens, NGOs, public bodiesWide awareness-raising, transparency
1-to-1, bilateral meetingAny, especially business/investment actorsSensitive, commercial or investment-related discussion
Site visit, knowledge exchangeAnyDiscussion based on practice in operational reality, peer learning


2. Communication channels
ChannelAudienceUse
EmailBusinesses, NGOs, public bodiesQuick, direct, low-cost contact
NewsletterAllRegular, digestible updates
Official letters or documentsPublic bodiesFormal decisions, agreements, invitations
Press releaseCitizens, NGOsWide, immediate dissemination
Social mediaCitizens, businesses, NGOsAwareness, informal engagement
Video conferenceAllLow-cost remote participation
1-to-1 discussionsAll, especially with decision-critical actorsTrust-building, sensitive decisions
PresentationAllStructured information-sharing, persuasion
VideoCitizens, NGOs, businessesWide, accessible explanation


  • How to apply? Cross-reference the method/channel with the stakeholder’s position on the power/interest heatmap. For instance, “Co-exist” stakeholders are well addressed by newsletters and public meetings, while “Integrate” stakeholders should be addressed by 1-to-1 meetings and workshops.
GPMP Toolbox

Engagement barriers

Used in · Your port today

What it is

1. Internal barriers
BarrierPossible causeHow to overcome it
Weak internal engagement cultureNo prior practice in working together, functional and technical departments working in isolationStart with internal alignment before external outreach; assign clear ownership
Internal silosDepartments working separately, no shared coordinationCreate an internal GPMP coordination group
Uncoordinated outreach across departmentsMultiple departments or projects contacting the same stakeholders independentlyAvoid repeating requests to stakeholders by using centralised communications.
Data or capacity gaps in the port organisationSmall teams, competing project demandsBuild internal capacity early; use external consultants for high-load tasks (surveys, feasibility studies)
Lack of time (project team)Competing internal priorities, understaffed engagement functionUse short, focused and well-prepared meetings
Lack of resources (project team)Limited budget and/or staff dedicated to engagementFocus first on stakeholders linked to priority measures
Difficulty finding the right contactComplex stakeholder landscape and weak internal knowledge of existing relationshipsAccount managers, customer relations teams and public affairs personnel can act as admins
Unclear importance of the stakeholder engagement exerciseEngagement is seen as an optional or secondary to technical workExplain the importance of engagement to the management. Link this activity with the GPMP approval and funding conditions.
Unclear use of stakeholder inputNo clear process for recording, analysing or feeding input into the GPMPUse a feedback log and show how stakeholder input affects actions, priorities or roadmap updates
Communicating the GPMP too abstractlyLong-term strategy is not translated into practical messagesPrepare simple messages for each stakeholder group, linking the GPMP to concrete actions, duties and benefits
Read the full description ›
Prefer to read everything?

What you see above is the summary written for the web. The whole chapter for this step, with the complete detail, tables and annexes, is one single document.

Return
Engagement barriers

What it is

1. Methods
MethodAudienceBest used for
QuestionnaireBusinesses, NGOs, public bodies, citizensBroad, quantifiable input at low cost
Needs surveyBusinesses, citizens, NGOsIdentifying areas of interest for follow-up
InterviewPublic bodies, businessesIn-depth or sensitive topics needing individual input
Focus groupBusinesses, NGOs, public bodiesDetailed feedback from a small, defined group
Online shared whiteboardKey/high-influence stakeholdersRemote visual co-creation
Collaborative researchAcademia, research centres, public bodiesEmbedding stakeholders directly in analysis
Creative labKey/high-influence stakeholdersExploring new solutions jointly
Think tankAcademia, public bodiesHigh-level policy advice
WorkshopBusinesses, NGOs, public bodiesCo-creation, problem-solving, validation
Hackathon / ideathonStudents, academia, internal teams, businesses, developersFast, intensive co-creation of concrete ideas or prototypes for a specific problem engages younger/technical audiences and brings new thinking to the GPMP process.
Public meetingBusinesses, citizens, NGOs, public bodiesWide awareness-raising, transparency
1-to-1, bilateral meetingAny, especially business/investment actorsSensitive, commercial or investment-related discussion
Site visit, knowledge exchangeAnyDiscussion based on practice in operational reality, peer learning


2. Communication channels
ChannelAudienceUse
EmailBusinesses, NGOs, public bodiesQuick, direct, low-cost contact
NewsletterAllRegular, digestible updates
Official letters or documentsPublic bodiesFormal decisions, agreements, invitations
Press releaseCitizens, NGOsWide, immediate dissemination
Social mediaCitizens, businesses, NGOsAwareness, informal engagement
Video conferenceAllLow-cost remote participation
1-to-1 discussionsAll, especially with decision-critical actorsTrust-building, sensitive decisions
PresentationAllStructured information-sharing, persuasion
VideoCitizens, NGOs, businessesWide, accessible explanation


  • How to apply? Cross-reference the method/channel with the stakeholder’s position on the power/interest heatmap. For instance, “Co-exist” stakeholders are well addressed by newsletters and public meetings, while “Integrate” stakeholders should be addressed by 1-to-1 meetings and workshops.
GPMP Toolbox

Digitalising Carbon Footprint Monitoring

Used in · Your port today

What it is

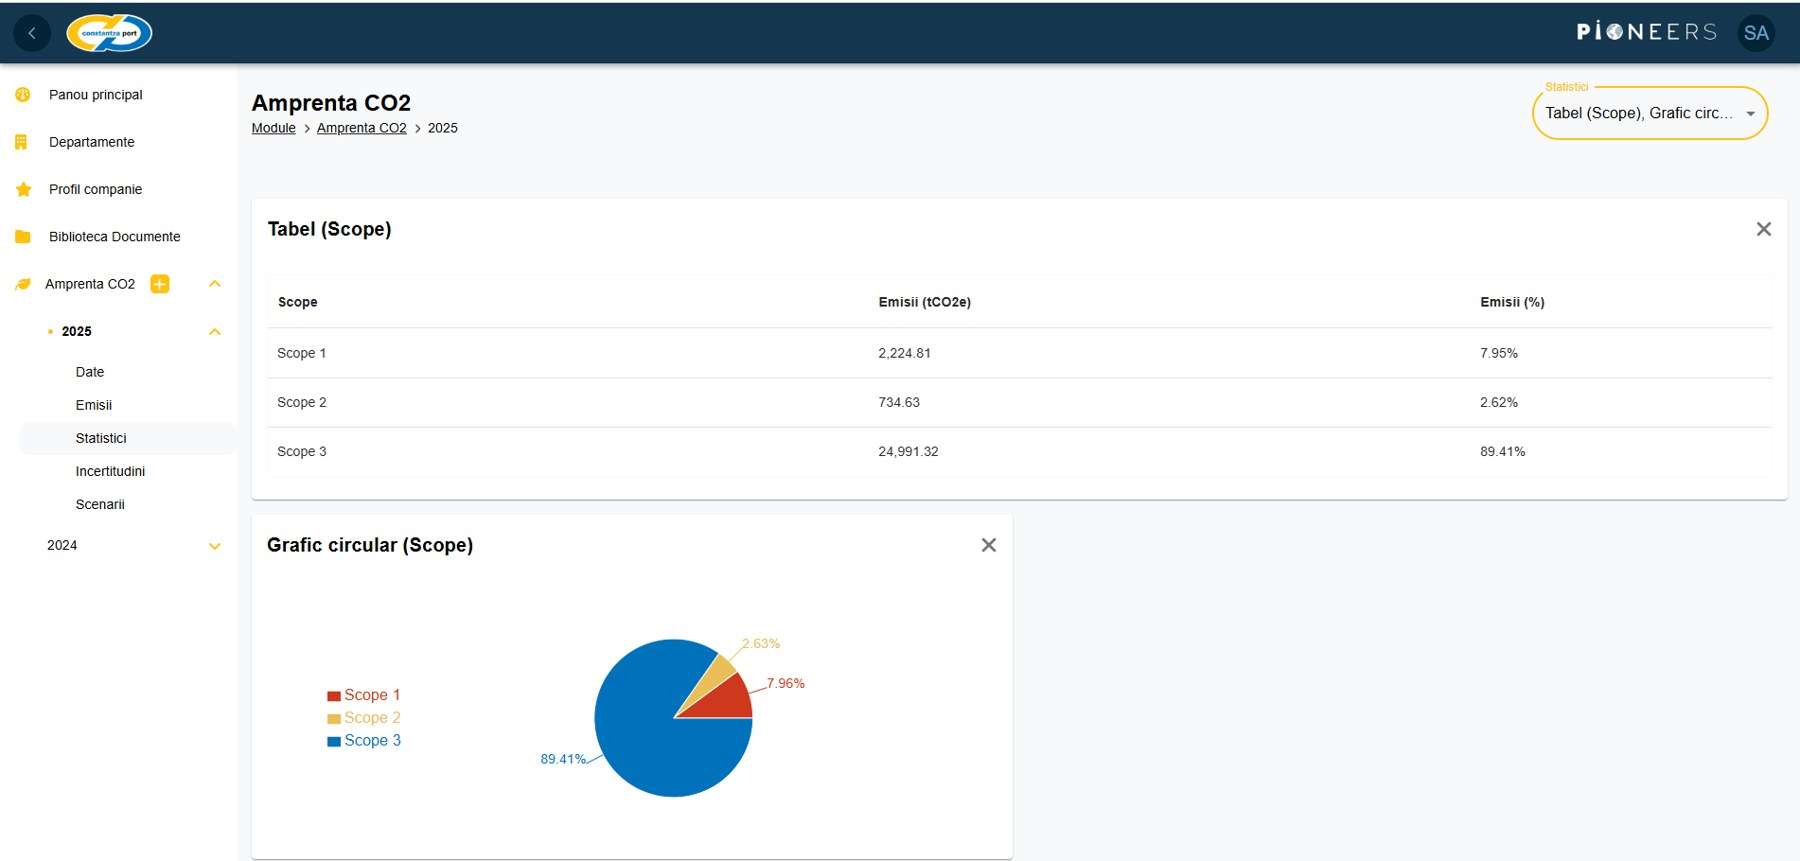
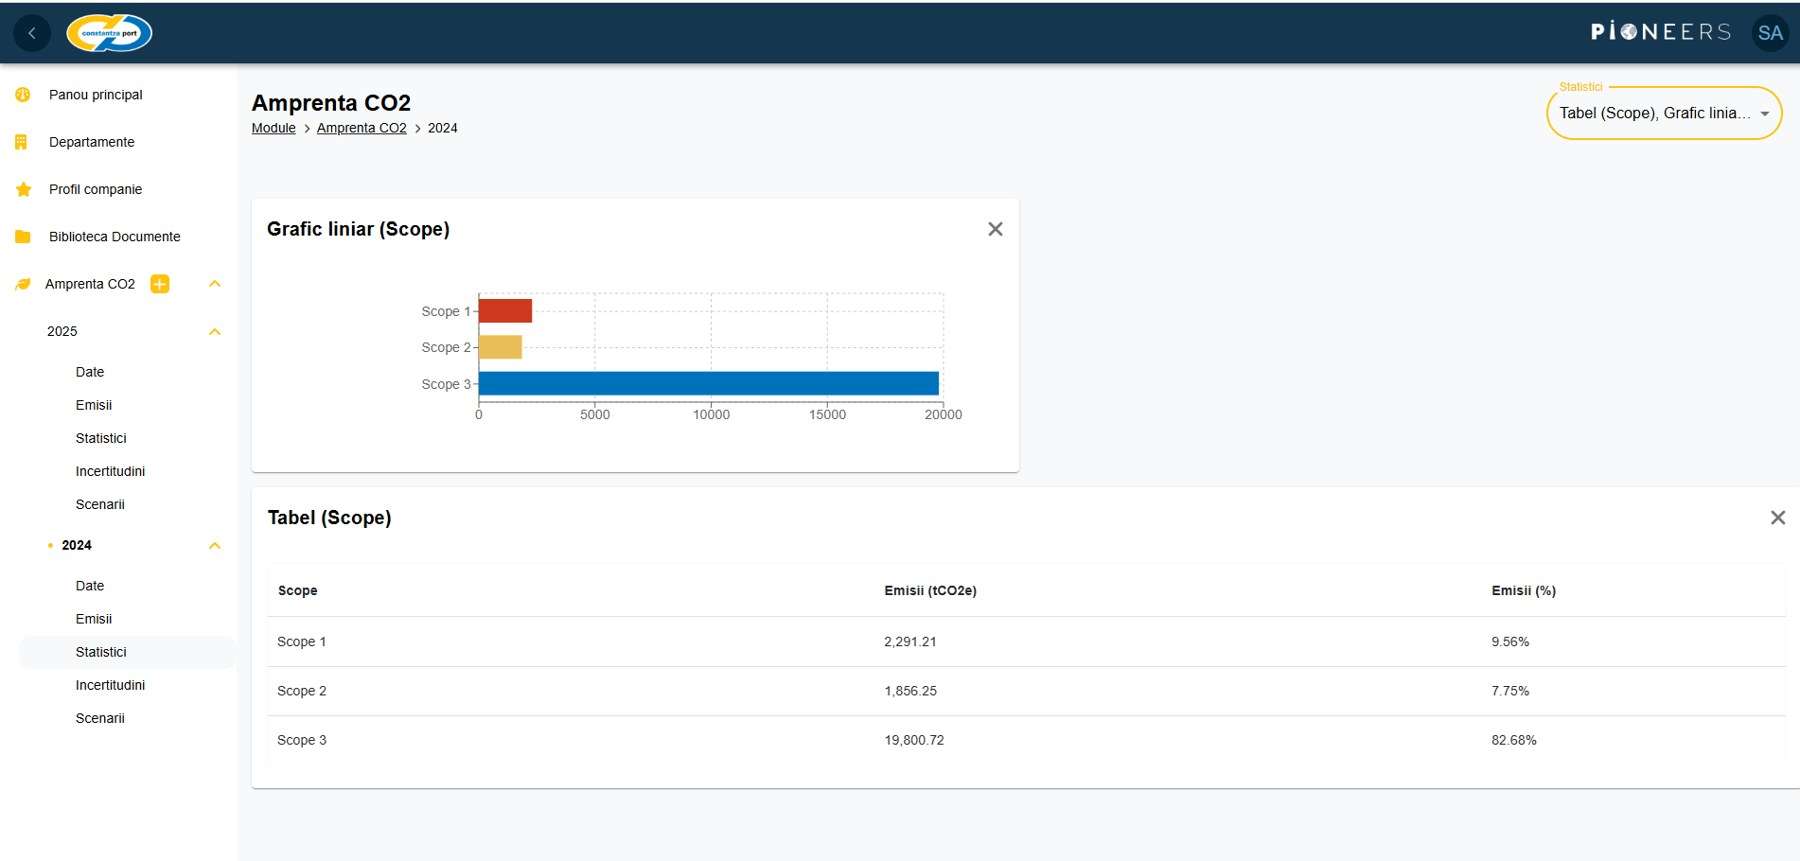
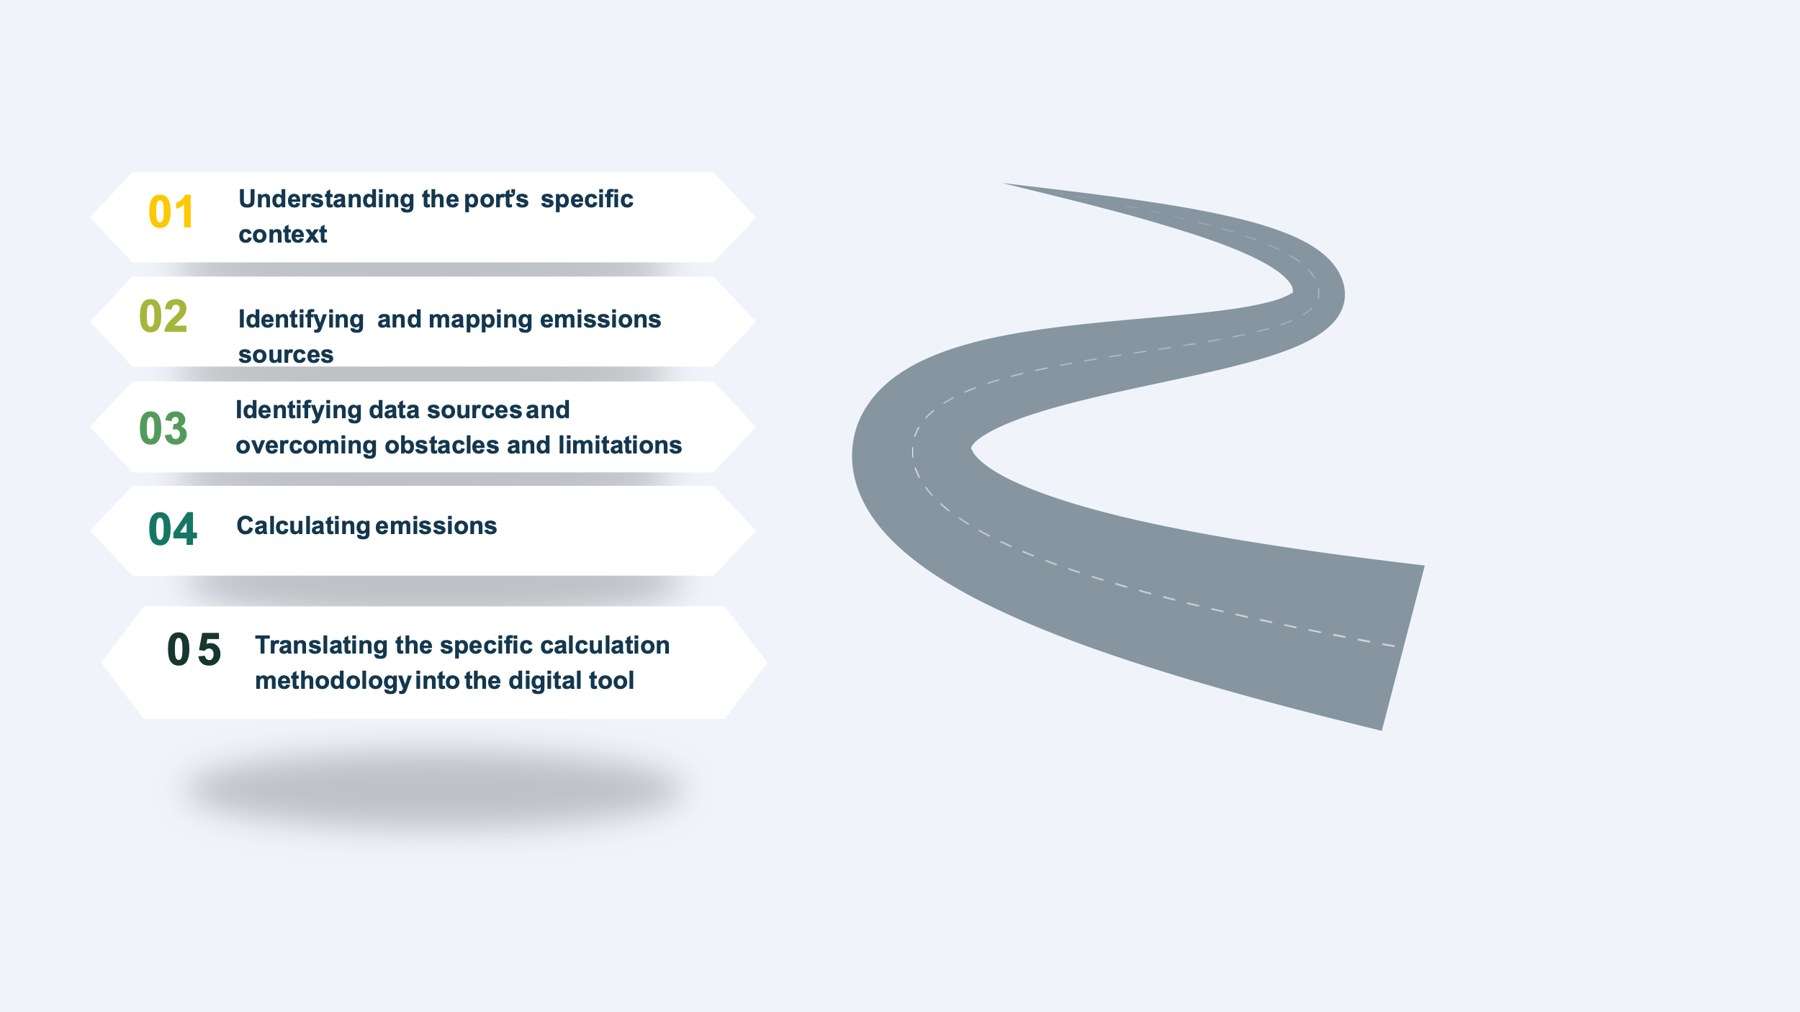
Calculating greenhouse gas (GHG) emissions is only the first step towards effective carbon management. To support continuous monitoring and informed decision-making, the Port of Constanța translated the emissions calculation methodology into a digital platform https://esg.portofconstantza.com/. The tool enables the port authority to collect data, calculate emissions consistently and monitor progress towards its decarbonisation objectives.

Digitalising the calculation process reduces manual work, improves data quality and ensures that emissions are calculated using the same methodology each reporting year. It also creates a reliable source of information for strategic planning, reporting and performance monitoring.

Read the full description ›
How to use it

The digital carbon footprint monitoring helps to ensure that emissions reporting becomes part of routine operational management rather than a separate annual exercise.

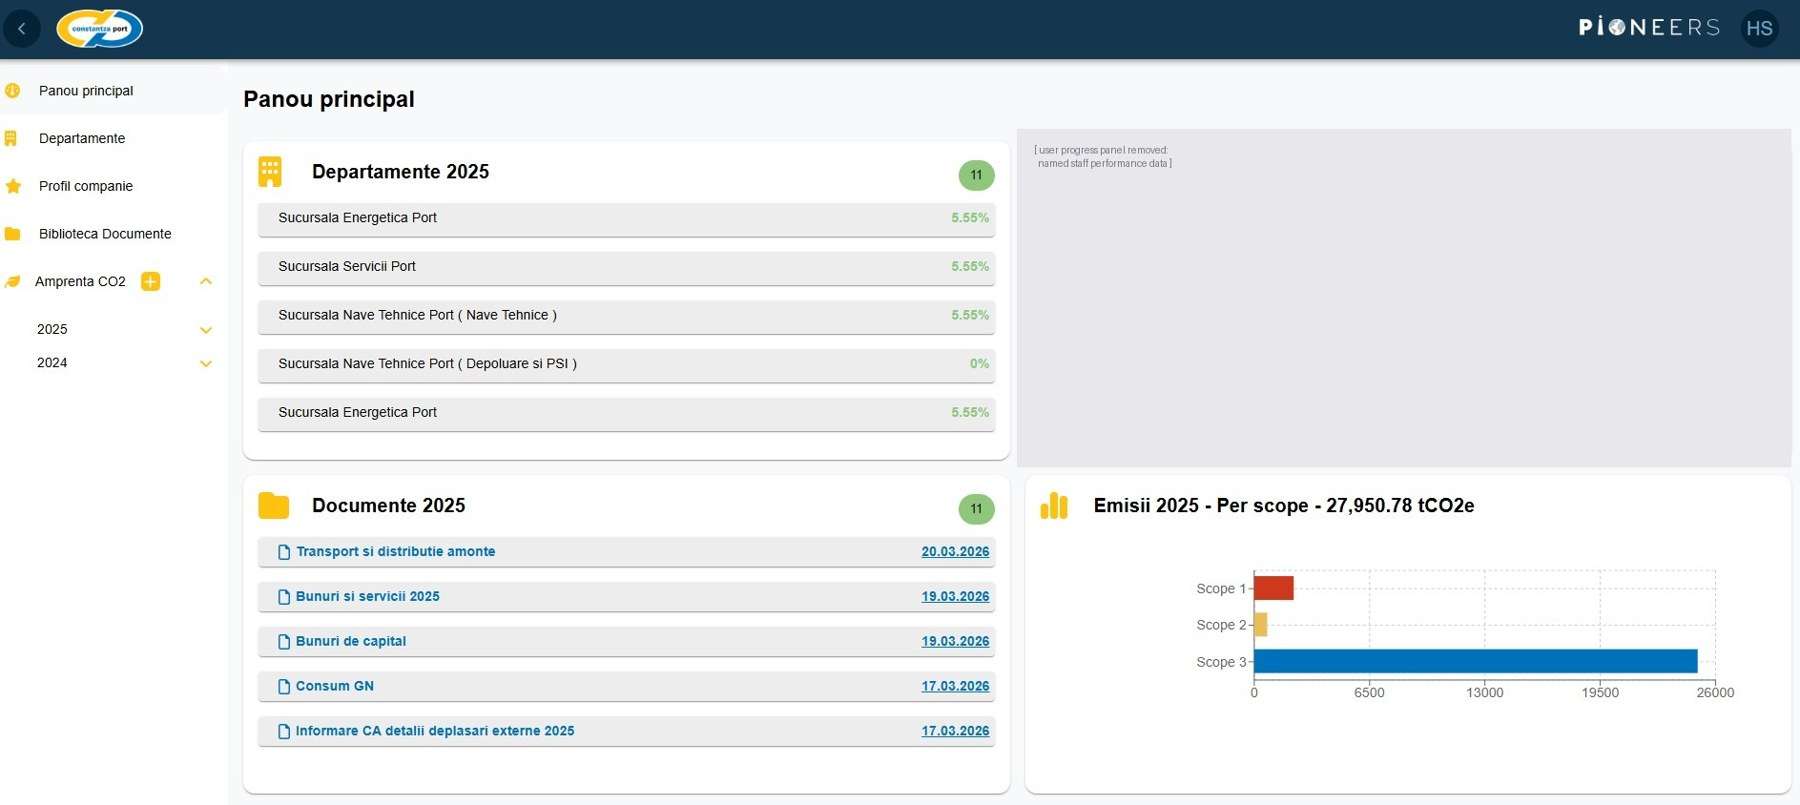
The digital carbon footprint monitoring
Click to enlarge

Beyond emissions reporting, the platform provides management with timely and reliable information for planning investments and monitoring performance. By presenting emissions data through dashboards and graphical reports, the application allows users to identify trends, compare reporting periods and evaluate the impact of implemented measures.

Read the full method ›
Prefer to read everything?

What you see above is the summary written for the web. The whole chapter for this step, with the complete detail, tables and annexes, is one single document.

Return
Digitalising Carbon Footprint Monitoring

What it is

Calculating greenhouse gas (GHG) emissions is only the first step towards effective carbon management. To support continuous monitoring and informed decision-making, the Port of Constanța translated the emissions calculation methodology into a digital platform https://esg.portofconstantza.com/. The tool enables the port authority to collect data, calculate emissions consistently and monitor progress towards its decarbonisation objectives.

Digitalising the calculation process reduces manual work, improves data quality and ensures that emissions are calculated using the same methodology each reporting year. It also creates a reliable source of information for strategic planning, reporting and performance monitoring.

The digital tool follows the same calculation logic as the greenhouse gas inventory. Every emission source, calculation rule and reporting category is integrated into the application, ensuring that results remain consistent with the approved methodology.

Rather than relying on spreadsheets or separate calculations, the platform provides a single environment for managing emissions data. This approach reduces the risk of calculation errors, improves traceability and simplifies annual reporting.

The application supports the complete reporting process, from data entry to the generation of emissions reports and performance indicators.

The digital platform allows authorised users to manage the entire emissions inventory through a single interface. Its main functions include:

  • recording operational data for electricity, fuels, transport, waste and other emission sources;
  • importing large datasets from standard spreadsheet templates;
  • automatically calculating greenhouse gas emissions for all reporting categories;
  • generating reports and summaries for management and external reporting;
  • exporting data for further analysis;
  • managing users and access rights; and
  • developing and comparing future emission reduction scenarios.
Return
Digitalising Carbon Footprint Monitoring

How to use it

The digital carbon footprint monitoring helps to ensure that emissions reporting becomes part of routine operational management rather than a separate annual exercise.

The digital carbon footprint monitoring
Click to enlarge

Beyond emissions reporting, the platform provides management with timely and reliable information for planning investments and monitoring performance. By presenting emissions data through dashboards and graphical reports, the application allows users to identify trends, compare reporting periods and evaluate the impact of implemented measures.

Scenario analysis is another important feature. The platform enables users to assess how different investment or operational decisions may influence future emissions. This functionality supports evidence-based planning and helps prioritise measures with the greatest potential impact.

As new data become available, the emissions inventory can be updated without repeating the entire assessment process, making the system suitable for continuous improvement.

The figures present examples of dashboard views showing emissions by reporting category and annual performance.

Click to enlarge
The digital carbon footprint monitoring 3
Click to enlarge

The technical architecture of the application, including software components, database structure, system integration and deployment architecture, is provided in Background knowledge.

GPMP Toolbox

Problem exploration

Used in · Your port today

What it is

Understanding the port ecosystem refers to the process of developing a comprehensive view of all the factors, actors, relationships, and external influences that shape how a port operates and how it can transition towards decarbonisation. Before any decarbonization action can be taken, all ports should understand these aspects. They include their internal activities, infrastructure, and governance, but also external factors. Think of the network of stakeholders that a port must leverage to take the appropriate actions, regulations, technologies, financial mechanisms, market conditions, social pressures, etc. A port must understand its own regime and how it is situated in the landscape.

How to use it

How to use it: four examples of the problem explorations of other ports

Within PIONEERS, all four ports used the Multi-Level Perspective (MLP) as the foundation for their problem-identification methodology. This means that ports should consider not only the factors they can influence directly, but also wider landscape pressures and developments beyond their control. The starting point for effective problem exploration is therefore a robust baseline assessment of the port’s existing regime. The quality of the exploration depends heavily on the quality of this baseline; without it, identifying the most significant decarbonisation challenges is difficult.

Read the full method ›
Prefer to read everything?

What you see above is the summary written for the web. The whole chapter for this step, with the complete detail, tables and annexes, is one single document.

Return
Problem exploration

How to use it

How to use it: four examples of the problem explorations of other ports

Within PIONEERS, all four ports used the Multi-Level Perspective (MLP) as the foundation for their problem-identification methodology. This means that ports should consider not only the factors they can influence directly, but also wider landscape pressures and developments beyond their control. The starting point for effective problem exploration is therefore a robust baseline assessment of the port’s existing regime. The quality of the exploration depends heavily on the quality of this baseline; without it, identifying the most significant decarbonisation challenges is difficult.

four examples of the problem explorations of other ports

While the objective was the same across all PIONEERS ports—to identify the key barriers and drivers affecting decarbonisation—each port adopted a different analytical approach. Antwerp-Bruges developed a systems map to visualise causal relationships and intervention zones within a complex multi-actor ecosystem. Barcelona combined STEEP and SWOT analyses with stakeholder surveys and root-cause analysis to uncover barriers embedded in organisational culture and values. Venlo used a three-layer landscape framework and stakeholder workshops to assess challenges shaped by regional, national and international influences, while Constanța applied a socio-technical regime analysis focusing on legacy infrastructure and established practices. These different approaches demonstrate that there is no single correct method; the most suitable approach depends on the port’s governance structure, available data and specific challenges.

A proven way to explore decarbonisation challenges is to create system and actor maps that identify the factors influencing decarbonisation and the stakeholders required to enable change. Such analyses help ports distinguish visible barriers from their root causes and identify leverage points where interventions are most likely to have a systemic impact. Equally important is validating the findings with stakeholders, ensuring that the resulting understanding reflects operational realities and creates a shared basis for action. By systematically exploring the problem space before developing solutions, ports can build a more accurate problem definition and establish a stronger foundation for effective decision-making and transition strategies.

Return
Best-practice example

Stakeholder engagement in the Port of Venlo

The transition towards a climate-neutral port cannot be achieved by a port authority or municipality acting alone. GPMPs require coordinated action by public authorities, businesses, infrastructure operators, knowledge institutions and society because many of the required investments, regulatory changes and operational improvements fall outside the responsibility of a single organisation. Stakeholder engagement therefore serves two complementary purposes: First, it improves the quality of the analysis by incorporating practical knowledge from those directly involved in port operations. Second, it creates ownership of the transition process, increasing the likelihood that the roadmap will be implemented successfully.

The PoV provides a good practice example because stakeholder engagement was not organised as a single consultation exercise at the end of the planning process. Instead, stakeholders were involved throughout the development of the GPMP, from validating the Landscape Analysis and identifying priorities to refining projects, evaluating innovation opportunities and developing the implementation roadmap. Two workshops, an ideathon and continuous one-to-one discussions were carried out during the development of the GPMP. This continuous engagement transformed the GPMP from an expert-driven document into a jointly developed transition strategy that reflects both long-term policy ambitions and operational realities.

The PoV engaged stakeholders to further define, refine and validate various levels of the MLP process. At the Landscape level, stakeholders validated the interpretation of global megatrends, national policy developments and regional dynamics, ensuring that the analysis reflected local conditions while remaining aligned with European and Dutch transition objectives. This was particularly important because many landscape developments, such as climate change, energy transition and digitalisation, influence ports indirectly and therefore require local interpretation before they can inform strategic planning. At the Niche level, stakeholders assessed innovative technologies and organisational concepts emerging from the PIONEERS project and other initiatives. Together they evaluated which innovations were technically feasible, organisationally acceptable and sufficiently mature to be included in the roadmap. In this way, stakeholder engagement connected external transition pressures with existing port practices and future innovation pathways, strengthening the overall robustness of the GPMP.


A Broad and Inclusive Stakeholder Ecosystem

One of the strengths of the PoV approach was the diversity of organisations involved. Rather than limiting participation to port operators, the GPMP engaged representatives from public authorities, infrastructure managers, logistics companies, industry, universities, business associations and neighbouring ports.

The validation workshop alone brought together twenty-one participants representing consultancies, universities, the Municipality of Venlo, the Province of Limburg, Rijkswaterstaat, terminal operators, logistics companies, energy companies, business associations including Limburg Waterboard, Supply Chain Valey Limburg and KBN, together with representatives from the Port of Antwerp-Bruges. This ensured that strategic decisions reflected multiple perspectives and that dependencies between organisations became visible early in the planning process. The wider governance structure of the PoV GPMP further strengthened this collaborative approach. Besides the municipality, organisations such as BluePorts Limburg, Supply Chain Valley Limburg, Brightlands Institute for Supply Chain Innovation, Rijkswaterstaat and the Limburg Water Board all contribute to the functioning and future development of the port ecosystem. The GPMP therefore recognised governance as a network rather than a single institutional actor.


From Consultation to Co-Creation

A distinguishing feature of PoV GPMP creation is that stakeholders actively shaped the content of the GPMP instead of merely reviewing completed analyses. During the first workshop, participants identified and prioritised projects across themes including green shipping, terminals, energy systems, circular economy, spatial planning and governance. Most priority actions were placed in the 2025–2030 implementation period, demonstrating consensus on the urgency of early action.

The workshops also identified three cross-cutting strategic priorities:

  • Energy system transformation through renewable energy, grid reinforcement and energy hubs;
  • Modal shift and zero-emission logistics through stronger inland shipping, rail and electrified last-mile transport;
  • Spatial and governance modernisation to support sustainable port growth.

These priorities subsequently formed the backbone of the Venlo GPMP. The second workshop focused on validation rather than repeating the first exercise. Participants challenged assumptions, refined priorities and translated broad ambitions into realistic implementation actions. This iterative process significantly strengthened the strategic quality of the GPMP.

The PoV also demonstrated that stakeholder engagement benefits from combining professional expertise with new perspectives. In addition to formal workshops, the GPMP included a multidisciplinary student ideathon in which independent student teams developed innovative concepts for a climate-neutral port without prior exposure to stakeholder results. Interestingly, many student proposals reinforced themes already identified during the workshops, validating the robustness of the stakeholder process. Other ideas expanded the solution space by introducing concepts related to shared infrastructure, digital coordination, automation and circular value creation. The winning concept proposed a central sustainability governance model coordinating investments, shared infrastructure and performance monitoring across the port ecosystem.


Improving the Quality of Strategic Decisions

Perhaps the greatest contribution of stakeholder engagement was not simply identifying projects but improving the quality of strategic decision-making.

Several examples illustrate this process:

  • Electrification evolved from a discussion about charging infrastructure into a broader energy system challenge involving electricity grid capacity, shared energy infrastructure and coordinated energy governance.
  • Rail transport priorities shifted towards general cargo rather than container transport after operational stakeholders clarified expected demand.
  • Spatial planning discussions resulted in concrete proposals for protecting waterfront functions, relocating incompatible land uses and intensifying industrial land use.
  • Digitalisation moved from being viewed as a supporting technology to becoming recognised as essential infrastructure underpinning energy management, logistics coordination and circular supply chains.

These refinements ensured that the final roadmap addressed systemic challenges rather than isolated technological solutions.


Integrating Stakeholder Engagement into the GPMP

Rather than concluding once the roadmap had been completed, stakeholder engagement became part of the implementation strategy itself. The GPMP includes a dedicated stakeholder engagement programme, recognising that implementation requires continuous collaboration throughout the Foundation (2025–2030), Scale-up (2030–2040) and Transformation (2040–2050) phases. Successful implementation depends on strong governance, capacity building within the municipality, transparent monitoring and sustained cooperation between regional and national partners.

This long-term perspective reflects one of the key lessons from the Landscape Analysis: because megatrends, policies and technologies continue to evolve, stakeholder engagement must also remain continuous to ensure that the Green Port Master Plan adapts to changing conditions while maintaining strategic direction.


Key Lessons from the Port of Venlo

The Port of Venlo demonstrates that effective stakeholder engagement extends well beyond consultation. Its success lies in embedding participation throughout the entire GPMP process—from interpreting global megatrends and validating analyses to identifying projects, refining priorities and supporting implementation. The process combined evidence-based analysis with practical operational knowledge, creating a roadmap that is technically sound, broadly supported and implementable.

For other ports developing a GPMP the principal lesson is that stakeholder engagement should be organised as an iterative co-creation process rather than a single consultation event. Engaging a diverse range of actors throughout the planning cycle improves the quality of strategic decisions, strengthens ownership of the transition pathway and increases the likelihood that long-term sustainability objectives can be translated into coordinated action.

Return
Best-practice example

Port of Constanța

The Port of Constanta developed its Green Port Master Plan (GPMP) by first establishing a comprehensive greenhouse gas (GHG) emissions baseline. The port identified and quantified the emissions generated by port authority activities and this evidence–based approach enabled to prioritise actions where they would have the greatest environmental impact.

The work followed two main steps:

  1. Calculate the port authority’s greenhouse gas emissions for the baseline year (2024) using internationally recognised accounting principles.
  2. Develop a decarbonisation strategy based on the identified emission sources and their relative contribution to the overall carbon footprint.

To support long-term monitoring and reporting, the calculation methodology was incorporated into a digital application that enables regular updates of the emissions inventory and supports future decision-making.


1. Calculate the port authority’s greenhouse gas emissions

The process for calculating the port authority`s greenhouse gas emissions and development a digital application was built on a on a set of premises that guided the work end-to-end illustrated graphically in the figure 1.

Process for developing the emissions baseline for the decarbonisation strategy; source- Report CO2 2024 -PoC by STRATOS
Click to enlarge
Understanding the port context

An accurate emissions inventory begins with clearly defining the organisational and operational boundaries of the assessment. For the Port of Constanța, the inventory focuses exclusively on activities that are directly managed or controlled by the port authority in the port perimeter. This approach ensures that reported emissions reflect areas where the organisation can implement and monitor improvement measures.

The assessment includes emissions generated through the operation and maintenance of port infrastructure, energy consumption in buildings, fuel use by the vehicle fleet and technical vessels, leased assets, outsourced services, employee commuting, business travel, and procurement activities. Emissions generated by commercial shipping or by independent terminal operators are not included because these activities are outside the operational control of the port authority.

Defining these boundaries at the beginning of the process provides a transparent basis for reporting, ensures consistency over time, and allows future inventories to be compared reliably.


Identifying and Mapping Emissions Sources

After defining the assessment boundaries, the port identified all activities that generate greenhouse gas emissions and grouped them according to GHG Protocols reporting categories. This structured approach ensures that all relevant emission sources are considered while avoiding overlaps or double counting.

The inventory distinguishes between three categories of emissions:

  • Direct emissions (Scope 1): emissions from fuel combustion, heating systems, port vehicles, technical vessels and refrigerants owned or operated by the port authority.
  • Indirect energy emissions (Scope 2): emissions associated with purchased electricity used in buildings and operational facilities.
  • Other indirect emissions (Scope 3): emissions generated throughout the value chain, including purchased goods and services, waste management, business travel, employee commuting and leased assets.

Grouping emissions into these categories helps identify where the largest impacts occur and supports the development of targeted reduction measures.

Emission sources included in the PORT Authority carbon footprint; source- Report CO2 2024 -PoC by STRATOS
Click to enlarge
Collecting and Managing Reliable Data

Reliable emissions calculations depend on the availability and quality of operational data. For this reason, the Port of Constanta first identified the information required for each emission source and determine where these data were available within the organisation. This process involved mapping data owners, reviewing existing records and assessing the completeness and quality of the available information.

The inventory combined data from multiple operational and administrative existing sources, including energy and fuel purchase records, meter readings, fleet consumption logs, maintenance records, procurement data, waste management records and employee mobility information.

Because the required information originated from different departments, establishing clear responsibilities for data collection proved essential. Early coordination reduced inconsistencies, improved data quality and shortened the overall assessment process.

Where complete information was unavailable, the port applied documented assumptions based on recognised international guidance. Recording these assumptions ensures that future inventories remain transparent and comparable over time.


Applying a Standardised Calculation Methodology

The Port of Constanța calculated greenhouse gas emissions using internationally recognised accounting principles and emission factors. Applying standard methodologies allows results to be compared with future reporting years and with other ports following the same approach.

For each activity included in scope 1, scope 2 and scope 3, operational data were converted into greenhouse gas emissions using recognised emission factors. Where direct activity data were not available, transparent estimation methods were applied and documented.

A detailed description of the calculation methodology, emission factors and assumptions is provided in the background knowledge section.


Carbon Footprint Results

The greenhouse gas inventory established a clear baseline for the reference year 2024 and identified the activities responsible for the largest share of emissions.

The assessment calculated a total carbon footprint of 23,343.72 tonnes of CO₂ equivalent (tCO₂eq) using the market-based approach. Indirect emissions (Scope 3) accounted for more than four-fifths of the total footprint, demonstrating that procurement decisions and supply chain activities have a greater influence on emissions than the port authority’s direct operations.

The results show distinct emission patterns across the three reporting categories:

  • Scope 1 represents approximately 10% of total emissions and is mainly associated with natural gas consumption for heating and diesel used by the vehicle fleet and technical vessels.
Scope 1
Click to enlarge

Scope 2 contributes approximately 8% of total emissions through purchased electricity. The assessment also highlights the importance of electricity procurement, as purchasing electricity with lower emission factors can significantly reduce reported emissions.

Scope 2
Click to enlarge

Scope 3 represents approximately 82% of total emissions. Most of these emissions originate from purchased goods and services, capital investments and other value chain activities, indicating that procurement policies play a critical role in achieving long-term emission reductions.

Scope 3
Click to enlarge

The inventory demonstrates that the greatest opportunities for decarbonisation extend beyond direct energy consumption. Investment planning, procurement practices and collaboration with suppliers are therefore essential components of an effective Green Port Master Plan.


Developing the GHG Emissions Reduction Strategy

A greenhouse gas (GHG) inventory identifies where emissions occur, but it does not reduce them. The next step is to translate the inventory results into a structured emissions reduction strategy that prioritises actions, guides investments and provides a long-term roadmap towards climate neutrality.

The Port of Constanța developed its emissions reduction strategy using the 2024 carbon footprint as the baseline. The strategy establishes a phased pathway for reducing greenhouse gas emissions over the coming decades and sets progressive targets that allow the port to monitor performance and adapt actions over time.

Using the 2024 emissions inventory as the reference point, the Port of Constanța aims to achieve:

  • approximately 41% reduction by 2030;
  • approximately 63% reduction by 2040; and
  • approximately 93% reduction by 2050.

The remaining emissions are expected to require additional technological solutions, alternative fuels or carbon removal measures as these become commercially and technically viable.

The emissions inventory showed that indirect emissions from procurement, investments and energy consumption represent the largest share of the port authority’s carbon footprint. Consequently, the strategy prioritises actions that address these major emission sources rather than focusing only on direct operational emissions.

Five strategic priority areas were identified: (1) low-carbon procurement and investments, (2) decarbonising electricity supply, (3) improving energy efficiency (4) modernising electrical infrastructure, (5) decarbonising transport and port operations.

The emissions reduction strategy is fully integrated into the Green Port Master Plan. Each strategic objective contributes to one or more GPMP pillars, ensuring that climate action supports the port’s wider objectives for sustainability, resilience and operational efficiency.

GPMP PillarsStrategic Objectives
Clean energy production, storage& supplyIncrease the use of renewable electricity and support electrification of port operations
Sustainable port designImprove energy efficiency, modernise infrastructure and integrate low-carbon solutions into buildings and investments
Modal shift and flow optimisationReduce emissions from transport, fleet operations and employee mobility
Circular EconomyImprove waste management, increase resource efficiency and reduce waste -related emissions
Digitalization and governanceStrengthen emissions monitoring, data management and performance reporting to support evidence – based decision – making
Best Practice

Define organisational boundaries before collecting data and assign clear responsibilities for each data source.

Use internationally recognised reporting standards to ensure consistency and comparability and document all assumptions to improve transparency and support future updates.

Integrate the approved emissions calculation methodology directly into the digital platform to improve consistency and traceability, automate calculations and reporting to reduce manual effort and minimise errors.

Use dashboards and performance indicators to support management decisions; update the emissions inventory regularly to monitor progress and support evidence-based decision-making.

Enable scenario analysis to evaluate the impact of future investments and operational changes.

Develop the emissions reduction strategy after completing a comprehensive carbon inventory and prioritise measures according to the largest emission sources rather than implementing isolated actions.

Define long-term targets supported by intermediate milestones; integrate decarbonisation objectives into procurement, investment planning and infrastructure development.

Combine technical measures with governance, digitalisation and continuous performance monitoring.


Lessons learned

The experience of the Port of Constanța demonstrates that a reliable carbon baseline could be the foundation of an effective Green Port Master Plan.

A digital carbon management platform is not only a reporting tool—it is a decision-support system. By combining reliable data collection, automated calculations and performance monitoring, ports can transform greenhouse gas reporting into a continuous management process that supports long-term decarbonisation and evidence-based investment planning.

An effective emissions reduction strategy is not a list of independent projects but a long-term management framework. By linking emissions data with investment planning, operational improvements and organisational governance, ports can direct resources towards the measures that deliver the greatest environmental benefit while maintaining operational efficiency and supporting future growth.


References

Analysis of activities and emission sources generated by port authority, methodology for quantifying greenhouse gas (GHG) emissions and calculating the associated carbon footprint for the reference year 2024; by STRATOS MANAGEMENT SRL.

Strategy, objectives and measures for reducing emissions generated by activities, services and administrative operations of port authority; by STRATOS MANAGEMENT SRL.

Technical documentation of architecture for carbon footprint accounting web platform; by AXERA SYMLOGIC and STRATOS MANAGEMENT SRL.

Return
Best-practice example

System mapping in the Port of Antwerp-Bruges

The transition to a climate-neutral port requires a systemic perspective. Ports are complex ecosystems where regulation, finance, technology, infrastructure, market dynamics and stakeholder actions continuously influence one another. System mapping is a valuable tool for problem exploration because it visualises these relationships, helping ports understand not only which factors affect decarbonisation, but also how they interact. Rather than addressing individual symptoms, system mapping reveals the underlying structures and feedback loops that determine whether the transition accelerates or stalls.

The PIONEERS Green Ports Systems Map was developed as a representation of the European port ecosystem and the factors influencing decarbonisation towards 2050. To keep the model manageable, system boundaries were defined, focusing on relevant actors and factors to the transition toward carbon-neutral ports.

The starting point to build the systems map was the actor map, which illustrates the network of stakeholders involved in the port ecosystem. The port ecosystem is a network of interdependent actors whose decisions shape whether decarbonisation accelerates or stalls. At its centre sits the port authority, not because it controls the network, but because it connects to nearly every part of it. The strongest force driving the system is regulation and policy makers, influenced by port authorities, federations, associations and unions. When climate regulation lands, its weight falls on the actors who must change how they operate: maritime, terminal and logistics stakeholders. The latter depend on investors, knowledge institutes, start-ups and other companies in a range of industries.

Port Ecosystem Map
Click to enlarge

The Green Port Systems Map consists of 23 leverage clusters grouped into five intervention zones: Technology, Infrastructure and operational readiness, Social and ecological context, Governance and policy, Financial and market dynamics, Planning, coordination and data. Together, these zones capture the key drivers, barriers and dependencies shaping port decarbonisation. The systems map helps ports identify leverage points: factors within the system where interventions can create the most significant and lasting change, linked to actors that actually have the power to put things in motion.

For example, climate regulations established by policymakers create pressure for operational change, but implementation ultimately depends on the willingness and ability of terminal operators, logistics companies and shipping lines to invest in low-carbon solutions. Such investments require confidence in both technological feasibility and stable regulatory frameworks, while emerging technologies often depend on support from energy providers, financial institutions and innovation ecosystems. In this interconnected system, the port authority can play a unique role by bringing actors together.

Click to enlarge
How to use it?

Although the Green Ports Systems Map provides a generic framework, its real value lies in contextualising it to the specific characteristics, stakeholders and challenges of an individual port. This enables ports to focus their efforts on the areas where they can generate the greatest systemic impact. Therefore, to use the map effectively, ports should begin by determining the biggest barriers that they can influence either directly or indirectly. At the same time it is important to focus on the factors that have the most potential to impact the system (instead of the symptoms).

A quick-start can be to “take the test” on the PIONEERS website to see what holds your port back most.


Conclusions from the Green Ports Systems Map for port authorities

For port authorities, the Green Ports Systems Map translates into three practical action perspectives. First, they can create the conditions for innovation by reducing administrative barriers, providing space for experimentation and facilitating the deployment of green technologies. Second, they can build coalitions by coordinating stakeholders across the value chain and aligning ambitions, investments and timelines. Third, they can shape the playing field by using their credibility and expertise to advocate for supportive policy and regulatory conditions at regional, national and European levels. Together, these roles reflect the port authority’s position as a facilitator of systemic change rather than a controller of the system.

GPMP Toolbox

Identifying, structuring and estimating the impact of trends on the port system

Used in · The world around you

What it is

The Landscape Analysis identifies the long-term external developments that influence the future of the port system but remain largely outside the direct control of the port authority. Rather than producing a comprehensive inventory of global trends, the analysis should focus on those developments that are expected to influence the port’s strategic development during the planning horizon. The objective is to understand how external pressures reshape the operating environment and to translate these insights into priorities for the GPMP.

Read the full description ›
Prefer to read everything?

What you see above is the summary written for the web. The whole chapter for this step, with the complete detail, tables and annexes, is one single document.

Return
Identifying, structuring and estimating the impact of trends on the port system

What it is

The Landscape Analysis identifies the long-term external developments that influence the future of the port system but remain largely outside the direct control of the port authority. Rather than producing a comprehensive inventory of global trends, the analysis should focus on those developments that are expected to influence the port’s strategic development during the planning horizon. The objective is to understand how external pressures reshape the operating environment and to translate these insights into priorities for the GPMP.

In order to incorporate the landscape trends, we propose a stepwise approach as summarised in the table below.


Landscape Analysis Guidelines
StepDescriptionOutput
1. Identify Global MegatrendsIdentify the long-term global and European developments affecting ports using scientific literature, international reports and European policy.List of Global Megatrends.
2. Identify National Policy TrendsAnalyse the national strategies, legislation and policy frameworks that translate global developments into the national context.Overview of National Policy Trends.
3. Identify Meso TrendsIdentify the regional, cross-border and local developments that shape the operating environment of the port.Overview of Meso Trends.
4. Analyse Trend Interactions and Strategic ImplicationsAnalyse how developments across the three Landscape levels interact and assess their implications for the port system.Strategic opportunities, risks and planning challenges.
5. Integrate the Findings into the GPMPUse the Landscape Analysis as the strategic foundation for the Regime Analysis, Innovation Assessment, Scenario Development and Roadmap.Strategic priorities for the GPMP.
Step 1 – Identify Global Megatrends

The first step establishes the global transition context within which the port system operates. It identifies the long-term structural developments that are expected to influence ports over the planning horizon and that are largely beyond the direct influence of individual port authorities. The analysis should be evidence-based and draw upon scientific literature, international organisations and European policy documents. Rather than compiling an extensive list of trends, the objective is to synthesise the most significant developments into a concise set of Global Megatrends that provide the foundation for the Landscape Analysis.


Step 2 – Identify National Policy Trends

The second step examines how the identified Global Megatrends are translated into national policy. National strategies, legislation and investment programmes define the regulatory and institutional framework within which ports operate and determine how international ambitions are implemented at country level. Analysing National Policy Trends provides insight into the policy drivers influencing infrastructure development, freight transport, energy transition, environmental performance and spatial planning.


Step 3 – Identify Meso Trends

The third step focuses on the regional, cross-border and local developments that directly shape the operating environment of the port. Meso Trends reflect the geographical, economic, institutional and environmental characteristics of the region, including regional governance, labour markets, infrastructure networks, energy systems and spatial constraints. Together with the Global Megatrends and National Policy Trends, these developments provide a complete understanding of the external Landscape surrounding the port system.


Step 4 – Analyse Trend Interactions and Strategic Implications

Once the three Landscape levels have been identified, the fourth step examines how they interact and reinforce one another. Global Megatrends influence national policy, while national frameworks shape regional developments and local implementation. Analysing these relationships provides a systems perspective that reveals how external developments collectively influence the future of the port. The resulting strategic implications are assessed for infrastructure, logistics, energy systems, industrial development, environmental performance, governance and stakeholder collaboration, helping to identify the principal opportunities, risks and investment priorities.


Step 5 – Integrate the Findings into the GPMP

The final step integrates the findings of the Landscape Analysis into the wider GPMP Rather than producing recommendations independently, the Landscape Analysis establishes the strategic context for all subsequent planning activities. The identified Global Megatrends, National Policy Trends, Meso Trends and their interactions provide direct input to the Regime Analysis, Innovation Assessment, Scenario Development and Strategic Roadmap. This ensures that strategic decisions are grounded in a comprehensive understanding of the long-term developments shaping the future of the port system.

Return
Best-practice example

Port of Venlo

The PoV provides a practical example of how the Landscape Analysis methodology can be applied within the development of a GPMP. The analysis followed the five-step approach presented in the GPMP toolbox. to ensure that external developments were systematically identified, structured and translated into strategic implications for the port. Rather than focusing solely on trends, the methodology connected long-term global developments with the realities of port planning and decision-making.


Step 1 – Identify Global Megatrends

The first step established the global transition context affecting the Port of Venlo. A structured literature review was conducted using scientific publications, European policy documents and reports from international organisations, including the European Commission, OECD, IPCC, IEA and UNCTAD. Rather than compiling an extensive inventory of trends, the analysis synthesised the findings into six Global Megatrends that were considered most relevant for the long-term development of inland ports:

  • Climate Change;
  • Energy Transition and Decarbonisation;
  • Technological and Digital Revolution;
  • Shifting Global Trade and Geopolitical Order;
  • Demographic and Socio-economic Transformation; and
  • Resilience and Systemic Awareness.

These Global Megatrends provided the strategic context for the remainder of the Landscape Analysis and established the long-term external developments influencing the future of the PoV.


Step 2 – Identify National Policy Trends

The second step translated the identified Global Megatrends into the Dutch policy context. National climate, energy, transport, spatial planning and inland shipping strategies were analysed to understand how international ambitions are implemented within the Netherlands and how these influence future port development.

The analysis included national policy frameworks such as the Dutch Climate Agreement, the National Environmental Vision (NOVI), freight transport strategies, energy transition policies and programmes supporting inland shipping and clean energy hubs. Together, these National Policy Trends provided the regulatory and institutional framework within which the Port of Venlo must operate and highlighted the principal policy drivers influencing future investments and strategic decisions.


Step 3 – Identify Meso Trends

The third step focused on the regional and cross-border developments that directly shape the operating environment of the PoV. The analysis considered the specific characteristics of the Limburg region, including spatial constraints, hydrological variability, regional energy infrastructure, cross-border logistics networks, labour market developments, circular economy initiatives and governance arrangements.

Particular attention was given to the shared BluePort Limburg vision for Limburg’s inland ports, recognising that many future opportunities and challenges can only be addressed through regional collaboration. Together, these Meso Trends complemented the Global Megatrends and National Policy Trends by providing a detailed understanding of the regional context in which the PoV operates.


Step 4 – Analyse Trend Interactions and Strategic Implications

Following the identification of the Global Megatrends, National Policy Trends and Meso Trends, the analysis examined how developments across the three Landscape levels interact and reinforce one another. Rather than considering each trend independently, a systems perspective was adopted to understand how global developments are translated into national policies and subsequently influence regional developments and local implementation. The resulting strategic implications were assessed for the Port of Venlo across several key themes, including infrastructure, logistics, energy systems, industrial development, governance, environmental performance and stakeholder collaboration. These findings enabled the project team to identify the principal opportunities, risks and investment priorities that require attention within the GPMP.

The preliminary findings were subsequently discussed with representatives of the PoV, the municipality and other key stakeholders. Their input was used to validate the analysis, identify additional regional developments and prioritise strategic themes according to the implementation horizons for 2025, 2030 and 2050.


Step 5 – Integrate the Findings into the Green Port Master Plan

The final step integrated the Landscape Analysis into the wider GPMP. The findings were not treated as a standalone assessment but formed the strategic foundation for the subsequent analytical stages. The identified Global Megatrends, National Policy Trends, Meso Trends and their strategic implications provided direct input to the Innovation Assessment, Scenario Development and Strategic Roadmap.

Continuous stakeholder engagement throughout the development of the GPMP ensured that the Landscape Analysis remained relevant to the local context while maintaining alignment with national policy objectives and long-term European transition ambitions. This integration enabled every strategic recommendation within the GPMP to be traced back to the external developments shaping the future operating environment of the PoV.


Key Lessons from the Port of Venlo

The application of the Landscape Analysis methodology in the PoV demonstrates that an effective Landscape Analysis extends beyond identifying external trends. Its value lies in combining evidence from multiple governance levels into a coherent understanding of the external environment within which the port operates. By systematically identifying Global Megatrends, National Policy Trends and Meso Trends, analysing their interactions and validating the findings through continuous stakeholder engagement, the Port of Venlo developed a transparent, evidence-based and transferable methodology for strategic port planning. The resulting Landscape Analysis provided a robust foundation for the GPMP and can serve as a best practice example for other inland and maritime ports seeking to develop long-term transition strategies towards climate neutrality.

The world around you

Global megatrends

Climate Change is one of the most significant Landscape developments shaping the future of ports, affecting the operational capabilities of ports, the physical resilience of port infrastructure and the strategic direction of port development. More frequent extreme weather events, sea-level rise and changing hydrological conditions increase the vulnerability of maritime and inland transport systems, requiring ports to integrate climate adaptation into long-term infrastructure planning and asset management. At the same time, Climate Change acts as a catalyst for broader systemic transformation by accelerating the Energy Transition & Decarbonisation, strengthening Regulation and Policy Pressure, and stimulating investments in renewable energy, resilient infrastructure, nature-based solutions and low-carbon logistics. Consequently, ports are shifting from reactive risk management towards adaptive planning, where resilience, environmental performance and economic competitiveness are considered as a combined objecive. Climate Change should therefore be understood not only as an environmental challenge but as a structural driver of technological, institutional and economic transformation across the port system1.

Energy Transition & Decarbonisation is closely linked to Climate Change and is fundamentally redefining the role of ports within regional energy and industrial systems. Driven by international climate commitments and European policies such as the European Green Deal, Fit for 55 and FuelEU Maritime, the transition from fossil fuels to renewable electricity and sustainable alternative fuels (SAF) is transforming both cargo flows and port functions. Rather than serving solely as transport gateways, ports are increasingly evolving into integrated energy hubs that support renewable energy generation, alternative fuel distribution, energy storage and industrial decarbonisation. This transition also stimulates technological innovation, Circular Economy initiatives and significant Infrastructure Investments, while creating uncertainty regarding future fuel demand and technology pathways. Consequently, Green Port Masterplans need to adopt flexible and adaptive strategies that integrate transport, energy and industrial development, ensuring that infrastructure remains resilient and relevant under different transition scenarios2.

The Technological and Digital Revolution is transforming port systems by reshaping how infrastructure, operations and supply chains are managed. Advances in Artificial Intelligence (AI), the Internet of Things (IoT), Digital Twins, automation and advanced data analytics enable real-time monitoring, predictive decision-making and more efficient coordination across increasingly interconnected logistics networks. As an enabling Landscape development, digitalisation supports Climate Change adaptation, the Energy Transition & Decarbonisation and Circular Economy initiatives by improving resource efficiency, energy management and operational resilience. However, greater digital integration also increases dependence on secure data sharing, interoperability and cybersecurity. Consequently, the challenge for ports is not simply to adopt new technologies, but to develop integrated and secure digital ecosystems that enhance resilience, sustainability and long-term competitiveness.

Shifting Global Trade & Geopolitical Order is reshaping the operating environment of ports through increasing geopolitical tensions, supply chain disruptions, changing trade patterns and growing economic uncertainty. Recent crises, including the COVID-19 pandemic and regional conflicts, have highlighted the vulnerability of global logistics networks and demonstrated the need for more resilient and diversified supply chains. As a result, ports are increasingly recognised as critical infrastructure that supports not only trade but also national energy security, industrial competitiveness and economic resilience. These developments reinforce the Energy Transition & Decarbonisation and the Technological and Digital Revolution by stimulating investments in regional energy corridors, strategic industries and integrated logistics infrastructure. At the same time, they increase the importance of cybersecurity, digital sovereignty and adaptive governance. Consequently, future port competitiveness will depend not only on operational efficiency but also on the ability to respond flexibly to evolving geopolitical and economic conditions.

Demographic & Socio-economic Transformation influences port development through ageing populations, labour shortages, changing skill requirements and rising societal expectations regarding sustainability and quality of life. These developments encourage greater automation and digitalisation while increasing the need for investment in education, workforce development and new technical competencies to support the transition towards renewable energy and digital logistics. At the same time, communities increasingly expect ports to contribute not only to economic growth but also to environmental quality, social well-being and transparent governance. Consequently, future port competitiveness will depend as much on attracting skilled labour, fostering stakeholder collaboration and maintaining societal support as on investing in physical infrastructure, reinforcing the need for integrated and inclusive Green Port Masterplans3.

Resilience & Systemic Awareness has become a defining Landscape development as ports face increasingly complex and interconnected disruptions arising from climate change, geopolitical instability, cyber threats, pandemics and economic uncertainty. Rather than focusing solely on recovering from operational disturbances, resilience is now understood as the capacity of infrastructure, institutions and supply chains to anticipate, adapt and continue functioning under changing conditions. This shift promotes adaptive planning, flexible infrastructure and stronger interoperability, enabling ports to respond effectively to multiple future scenarios. As resilience depends on digital technologies, diversified energy systems and regional collaboration, it acts as an integrating principle that connects the other Global Megatrends and supports the long-term sustainability, competitiveness and adaptability of port systems4.

References

  1. IPCC. (2023). Climate Change 2023: Synthesis Report; Becker, A. et al. (2013). Climate Change Adaptation for Seaports. https://www.ipcc.ch/report/ar6/syr/downloads/report/IPCC_AR6_SYR_LongerReport.pdf
  2. European Commission. (2023). European Green Deal; Fit for 55 Package; IEA. (2023). World Energy Outlook. https://iea.blob.core.windows.net/assets/86ede39e-4436-42d7-ba2a-edf61467e070/WorldEnergyOutlook2023.pdf
  3. OECD. (2021). The Circular Economy in Cities and Regions; European Commission. (2023). Skills Agenda for Europe.
  4. UNCTAD. (2023). Review of Maritime Transport; OECD. (2023). Global Value Chains and Supply Chain Resilience.
The world around you

Meso-Level Responses

The interaction between the Global Megatrends gives rise to a series of Meso-Level Responses that gradually transform the existing port regime. Unlike the Landscape, which represents external developments beyond the direct influence of ports, these responses emerge through the combined actions of governments, industries, infrastructure managers and technology providers. They translate long-term global pressures into tangible changes in policy, investment, governance and operational practice.

One of the most visible responses is the increasing emphasis on the Circular Economy, which extends the traditional logistics function of ports towards resource efficiency, industrial symbiosis and closed material cycles. Ports are increasingly viewed as locations where industrial activities, waste management, renewable energy production and logistics can be integrated to maximise resource utilisation while reducing environmental impacts. This development reflects the combined influence of Climate Change, Energy Transition & Decarbonisation and changing societal expectations, demonstrating how environmental objectives increasingly shape economic development strategies.

Simultaneously, Regulation and Policy Pressure has become one of the strongest drivers of change within port systems. International climate agreements, European legislation and national sustainability strategies establish progressively stricter requirements regarding greenhouse gas emissions, air quality, energy efficiency and environmental performance. European policy pressure is reflected in the European Climate Law, the EU ETS and the Fit for 55 package, which establish increasingly stringent requirements for emissions reduction, energy efficiency and low-carbon investment. For ports, these requirements are reinforced by policies such as AFIR and FuelEU Maritime, while the Clean Industrial Deal and the proposed 2026 EU ETS revision seek to balance decarbonisation with industrial competitiveness and investment capacity. Rather than responding voluntarily to sustainability objectives, ports increasingly operate within regulatory frameworks that influence investment priorities, infrastructure design and operational practices. Policy therefore acts as a mechanism that accelerates the translation of Landscape pressures into structural transformation of the port regime.

The transition also strengthens the strategic role of Ports as Energy Hubs. As renewable energy production expands and alternative fuels become increasingly important, ports evolve into critical nodes within regional energy systems. Hydrogen production, offshore wind integration, electricity distribution, battery storage and carbon management become additional functions alongside conventional cargo handling. This diversification demonstrates that future competitiveness depends not only on transport performance but also on the capacity to integrate logistics, energy and industrial development within a single ecosystem.

Digital technologies provide another essential response through the implementation of IoT, Digital Twins and Interconnected Logistics. These technologies improve situational awareness, optimise resource utilisation and strengthen collaboration between stakeholders. Together with increasing Automation, they address labour shortages, improve operational efficiency and enhance safety while supporting more flexible and resilient logistics networks. At the same time, digitalisation creates new governance challenges related to cybersecurity, interoperability and data sharing, requiring coordinated standards and institutional cooperation.

Finally, Societal Expectations and Infrastructure Investments increasingly reflect a long-term transition perspective rather than isolated infrastructure expansion. Investments are expected to contribute simultaneously to economic competitiveness, environmental sustainability and regional resilience. Consequently, future infrastructure is increasingly designed as multifunctional systems that integrate transport, renewable energy, digital technologies and ecological considerations. These responses collectively illustrate that port development is no longer driven by cargo growth alone but by the need to respond to interconnected societal, technological and environmental transitions.

The Landscape Analysis demonstrates that multiple Global Megatrends. are major drivers of the port transformation rather than by individual developments in isolation. These developments are transforming ports into multifunctional logistics, industrial and energy ecosystems, where competitiveness increasingly depends on resilience, sustainability, digitalisation and collaborative governance. As these Landscape pressures continue to evolve, Green Port Masterplans need to adopt integrated and adaptive planning approaches that recognise the interdependencies between environmental, technological, economic, societal and political transitions. Landscape Analysis therefore provides the strategic context by identifying the external drivers that shape future port transformation pathways.


Analytical synthesis of the Landscape Analysis
Global MegatrendMain Landscape PressureMeso-Level Responses and DerivativesStrategic implication for ports
Climate ChangePhysical climate risks and decarbonisation requirementsCircular Economy, Regulation & Policy PressureClimate-resilient infrastructure and adaptation become strategic priorities.
Energy Transition & DecarbonisationTransition towards renewable energy and alternative fuelsPorts as Energy Hubs, Infrastructure InvestmentsPorts evolve into integrated energy and industrial ecosystems.
Technological & Digital RevolutionDigitalisation, automation and data-driven decision-makingArtificial intelligence, IoT, Digital Twins, AutomationImproved efficiency, predictive management and resilient operations.
Shifting Global Trade & Geopolitical OrderSupply chain disruption and changing trade patternsInfrastructure diversification and regional cooperationGreater emphasis on resilience, strategic autonomy and flexible logistics.
Demographic & Socio-economic TransformationLabour shortages and changing societal expectationsAutomation, Societal ExpectationsInvestment in skills, innovation and collaborative governance.
Resilience & Systemic AwarenessIncreasing frequency of complex disruptionsIntegrated planning and adaptive infrastructureLong-term resilience becomes a central planning objective.
GPMP Toolbox

Innovation scouting and innovation radar

Used in · Innovations to use

What it is

Innovation scouting and the innovation radar developed in PIONEERS Work Package 1 provides a broad and evolving overview of relevant innovations and niche developments in ports and beyond. The innovation selection with the help of an innovation radar creates a more systematic basis for identifying suitable solutions and comparing them against defined criteria. This strengthens the GPMP process by connecting strategic priorities with expert-driven innovation selection, instead of relying only on trends, assumptions, or isolated project ideas.

Read the full description ›
How to use it

Ports are supported with a method for identifying which innovations are most suitable for their own operational context, transition priorities, and implementation capability rather than a list of interesting technologies. In practical terms, a structured way of selection process makes the radar highly relevant for master planning. The Innovation Radar is designed as both a visual mapping tool and a structured pre-selection instrument for port innovation. It enables users to choose innovations according to their relevance for the four PIONEERS transition pillars, clean energy production and supply, sustainable port design, modal shift and flow optimisation, and digital transformation. The innovation radar also indicating how close an innovation is to practical deployment through its Innovation Readiness Level. Within this structure, each innovation is positioned according to its Innovation Readiness Level, calculated as the average of Technology Readiness Level, Market Readiness Level, and Social Readiness Level. This provides an immediate sense of maturity while also recognising that readiness is not purely technical but also depends on market readiness and social acceptance. In this sense the radar is a visual overview and an analytical filter.

Read the full method ›
Lessons learned

The innovation assessment at the WP1 generated several important lessons for master planning. One of the main takeaways is that technical maturity alone is not enough to decide whether an innovation is worth pursuing. Many technical solutions look promising, but still be difficult to integrate to existing operations, poorly supported by stakeholders, or limited in its potential to scale. Another important lesson is the importance of criteria changes depending on the port context. Large cargo seaports may place greater weight on impact, scalability, and stakeholder support, while inland or more peripheral ports may prioritise feasibility and readiness. Third, stakeholder feedback is essential to make the radar credible and usable. The radar works best when it supports structured discussion among port actors rather than replacing judgement with a purely mechanical score. Overall, the innovation radar act as a bridge between innovation scouting and master planning. It helps in turning a large and diverse innovation pool into a more focused and actionable portfolio for further assessment and deployment. In that sense, the radar is not only a tool for innovation assessment, but also a practical instrument for improving the quality, consistency, and strategic relevance of innovation choices in port master planning.

Prefer to read everything?

What you see above is the summary written for the web. The whole chapter for this step, with the complete detail, tables and annexes, is one single document.

Return
Innovation scouting and innovation radar

What it is

Innovation scouting and the innovation radar developed in PIONEERS Work Package 1 provides a broad and evolving overview of relevant innovations and niche developments in ports and beyond. The innovation selection with the help of an innovation radar creates a more systematic basis for identifying suitable solutions and comparing them against defined criteria. This strengthens the GPMP process by connecting strategic priorities with expert-driven innovation selection, instead of relying only on trends, assumptions, or isolated project ideas.

The PIONEERS Innovation Radar, developed in Work Package 1, is a practical screening tool designed to help ports identifying and prioritising innovations that are most relevant for their green transition pathway. It was created as a structured screening approach for more than 350 innovations scouted within WP 1.

Return
Innovation scouting and innovation radar

How to use it

Ports are supported with a method for identifying which innovations are most suitable for their own operational context, transition priorities, and implementation capability rather than a list of interesting technologies. In practical terms, a structured way of selection process makes the radar highly relevant for master planning. The Innovation Radar is designed as both a visual mapping tool and a structured pre-selection instrument for port innovation. It enables users to choose innovations according to their relevance for the four PIONEERS transition pillars, clean energy production and supply, sustainable port design, modal shift and flow optimisation, and digital transformation. The innovation radar also indicating how close an innovation is to practical deployment through its Innovation Readiness Level. Within this structure, each innovation is positioned according to its Innovation Readiness Level, calculated as the average of Technology Readiness Level, Market Readiness Level, and Social Readiness Level. This provides an immediate sense of maturity while also recognising that readiness is not purely technical but also depends on market readiness and social acceptance. In this sense the radar is a visual overview and an analytical filter.

To make the radar more useful for decision-making in real port contexts, WP1 extended the radar through a Multi-Criteria Decision Analysis approach. Five criteria were defined:

  1. Impact
  2. Feasibility
  3. Scalability
  4. innovation readiness,
  5. Stakeholder support

These criteria were intentionally kept generic so that ports can adapt them to their own context. The weighting of criteria is supported through the Analytic Hierarchy Process, which allows decision-makers to reflect differences in port type, size, geography, and strategic priorities when assessing innovation suitability. The figure below gives the pictorial representation of our PIONEERS innovation radar:

Innovation Radar from D1.4 innovation assessment year 4
Click to enlarge

The assessment mechanism in the radar supports to move beyond a static overview of innovations and function as a practical filtering mechanism, helping ports identify which solutions are not only promising in principle, but also credible, adaptable, and strategically relevant for inclusion in the Green Port Master Plan. The PIONEERS innovation radar for maritime can therefore be framed as an early-stage filter within the broader Green Port Master Plan process.

GPMP Toolbox

PAM assessment

Used in · Innovations to use

What it is

One of the tools developed within PIONEERS was the PIONEERS Assessment Model (PAM). Impact monitoring is essential to evaluate technologies in a fair and consistent way and to provide valuable insights for stakeholders. During the development of PAM, several challenges had to be addressed to ensure the model was accurate, robust, and flexible.

The first challenge was the diversity of technologies tested in PIONEERS. The project included a wide range of innovations, from digital solutions that improve efficiency and productivity to physical technologies that supply electricity to terminal vehicles or hydrogen to heating systems. As a result, a single set of indicators could not be applied to all demonstrations. The second challenge concerned stakeholder needs. Policymakers, industry partners, knowledge institutions, and port authorities require different information to evaluate success. Consequently, the relevant key performance indicators (KPIs) vary depending on the stakeholders; perspective and requirements. The third challenge was ensuring robustness. While highly detailed impact monitoring is theoretically possible, in practice data availability is limited due to collection constraints during the demonstration, GDPR regulations, and commercial sensitivities. PAM therefore relies on reliable data that can be collected relatively easily without requiring confidential information.

How to use it

To address these challenges, PAM was designed with three levels of aggregation. At the operational level, KPIs measure the direct impact of individual demonstrations. These indicators feed into tactical indicators, which assess groups of similar technologies, often aligned with the four PIONEERS demonstration pillars. At the highest level, strategic indicators evaluate the overall success of the project. In addition, PAM distinguishes between social indicators, which capture external costs and benefits, and business-economic indicators, which assess economic feasibility and operational performance. The figures below visualize the three levels of aggregation and the socio-, and business-economic indicators.

Read the full method ›
Prefer to read everything?

What you see above is the summary written for the web. The whole chapter for this step, with the complete detail, tables and annexes, is one single document.

Return
PAM assessment

How to use it

To address these challenges, PAM was designed with three levels of aggregation. At the operational level, KPIs measure the direct impact of individual demonstrations. These indicators feed into tactical indicators, which assess groups of similar technologies, often aligned with the four PIONEERS demonstration pillars. At the highest level, strategic indicators evaluate the overall success of the project. In addition, PAM distinguishes between social indicators, which capture external costs and benefits, and business-economic indicators, which assess economic feasibility and operational performance. The figures below visualize the three levels of aggregation and the socio-, and business-economic indicators.

This framework was applied across all 19 demonstrations, providing detailed assessments at the demo level while also generating insights at the tactical and strategic levels. PAM can support ports both before and after implementation. Before implementation, it can estimate the expected impact of a technology using assumptions and expert input. After implementation, it can measure actual performance using operational data and, in some cases, assess the potential effects of scaling up the technology, although such projections should be interpreted with caution due to increasing implementation complexity.

PAM
Click to enlarge
operational, tactical, and strategic KPIs for PAM
Click to enlarge
Return
Best-practice example

Port of Barcelona

The Port of Barcelona developed its roadmap to translate the Green Port Master Plan into a practical implementation framework for the transition towards a Smart Energy Hub. The roadmap establishes a structured pathway that aligns strategic objectives, investments and governance mechanisms over time. Intermediate milestones for 2025 and 2030 support a phased transition towards the long-term vision for 2040 while considering technology maturity, regulatory developments and investment capacity.


  • Roadmap methodology

The roadmap is organised around three structural axes that guide the energy transition: the shift from fossil to renewable energy sources, the reduction of energy carbon intensity, and improvements in energy and operational efficiency. Together, these axes provide the technical foundation for achieving the port’s decarbonisation objectives.

Building on these structural axes, the roadmap defines six strategic objectives covering decarbonisation, sustainability, resilience, innovation, ecosystem integration and harmonious cohabitation. Each objective is implemented through one or more Development Lines that include a main milestone, programmes, expected results and a portfolio of prioritised actions scheduled across different implementation horizons. technological developments, regulatory changes and evolving strategic priorities. The figure below provides an example of how a Development Line is translated into concrete programmes, milestones and implementation targets.

To support implementation, the roadmap is complemented by a monitoring framework that assigns Key Performance Indicators (KPIs) to each strategic objective and Development Line. Annual monitoring enables progress to be tracked against defined targets, while a comprehensive review every five years ensures that the roadmap remains aligned with technological developments, regulatory changes and evolving strategic priorities

Port of Barcelona Roadmap
Click to enlarge

Example of a Development Line from the Port of Barcelona Roadmap


  • Prioritisation and implementation

Actions are prioritised using a multi-criteria assessment based on impact, implementation effort and implementation period. Additional factors such as greenhouse gas mitigation potential, technology readiness, investment requirements, stakeholder complexity and strategic alignment ensure that resources are allocated to actions with the greatest overall value. Implementation is phased across four planning horizons (2025, 2030, 2035 and 2040), allowing the roadmap to combine early actions with long-term investments.

  • Best practices
  • Start with a clear strategic vision and translate it into a structured roadmap.
  • Combine short-, medium- and long-term planning to balance immediate actions with long-term transformation.
  • Apply transparent prioritisation criteria to support objective decision-making and resource allocation.
  • Integrate monitoring through KPIs and regular roadmap reviews.
  • Review the roadmap periodically to adapt to technological, regulatory and market changes.
GPMP Toolbox

Co-Transferability

Used in · Build your roadmap

What it is

The co-transferability workstream of the PIONEERS project set in place a process to ‘…drive accelerated transfer and deployment of green port solutions amongst the PIONEERS ports, resulting in measurable progress and commitments during and beyond the project timeframe.’ By sharing the transferability framework and methods applied by the partners of the PIONEERS project, as well as the main lessons learned, we hope to inspire and inform future similar innovation transfer processes – whether these are implemented by similar multi-party consortia, or independently by port authorities.

Read the full description ›
How to use it

The co-transferability process outlined below represents a simplified version of that applied by PIONEERS, taking into account lessons learned:

Step 1: Identify transfer stakeholders – The relevant transfer organisation for some port technologies will be the port authority, but in many cases one or more additional stakeholders (such as terminal operators, inland waterway authorities and energy utilities etc.) will need to be convinced of the operational, commercial and environmental benefits etc. Others may play supporting roles for the implementation and subsequent operation (universities providing training and innovation services, logistic operators providing data, emergency services, etc.)

Read the full method ›
Prefer to read everything?

What you see above is the summary written for the web. The whole chapter for this step, with the complete detail, tables and annexes, is one single document.

Return
Co-Transferability

What it is

The co-transferability workstream of the PIONEERS project set in place a process to ‘…drive accelerated transfer and deployment of green port solutions amongst the PIONEERS ports, resulting in measurable progress and commitments during and beyond the project timeframe.’ By sharing the transferability framework and methods applied by the partners of the PIONEERS project, as well as the main lessons learned, we hope to inspire and inform future similar innovation transfer processes – whether these are implemented by similar multi-party consortia, or independently by port authorities.

Based on our experience, the transferability of green port technologies is dependent on a wide range of factors, and the different PIONEERS Work Packages for co-transferability (WP8), commercial exploitation (WP1) and impact assessment (WP9) methodologies approached this from different perspectives. The two main elements comprised:


  • Co-transferability process –the main framework of transfer steps undertaken by the PIONEERS ports, to assess the transfer potential of multiple demos, and to define specific transfer activities to be undertaken during the project.
  • Port-related conditions and readiness – a series of physical, infrastructural and organisational conditions that need to be in place for a transfer to succeed,

These different elements of the approach are explained further below, together with examples from the project, to support the design of future transfer approaches.

Return
Co-Transferability

How to use it

The co-transferability process outlined below represents a simplified version of that applied by PIONEERS, taking into account lessons learned:


Step 1: Identify transfer stakeholders – The relevant transfer organisation for some port technologies will be the port authority, but in many cases one or more additional stakeholders (such as terminal operators, inland waterway authorities and energy utilities etc.) will need to be convinced of the operational, commercial and environmental benefits etc. Others may play supporting roles for the implementation and subsequent operation (universities providing training and innovation services, logistic operators providing data, emergency services, etc.)

For the PIONEERS Container Handling Equipment demos, it was important to reach out to terminal operators at each port to understand their ambitions for electrification, hydrogen fuelling and automation of terminal operations.


Step 2: Screen transfer potential – Transfer screening involves the presentation of green port technologies to gain an initial understanding of whether: key port-related conditions are fulfilled; whether other related and equivalent technologies are already planned or deployed; and an initial view on the environmental, social, operational and commercial value of transfer. A decision could be taken to focus on the most promising green port technologies at this stage.

For the PIONEERS Vessel Traffic Optimisation demo, conversations with Port of Constanta revealed that the scale and complexity of maritime vessel movements would not warrant implementation of a new system. Through discussions, it was learned that vessel congestion can occur where the Danube-Black Sea Canal enters the port. An adapted transfer pilot was therefore arranged in liaison with the inland waterway authority.


Step 3: Transfer scope and activities planning – Where good potential for technology transfer has been identified through the screening process, this step provides the basis for transfer implementation and involves a combination of:

  • Identifying technology components to be transferred – technologies can be divided into different components and service levels, only some of which may be transferred. There may be value in transferring a data transfer process; a regulatory approach; or a specific technical component of a technology.

The hydrogen dual-fuelled straddle carrier tested at the Port of Antwerp-Bruges involves engine technology that could be used in other types of port equipment, and knowledge gained on the safe handling of hydrogen could also be shared. To provide another example, the electric propulsion of barges using modular battery container relies on a number of demo components being implemented simultaneously: retrofit/procurement of barges with electric motors; installation of charging stations at a network of ports; potential deployment of renewable energy generation.

  • Planning of transfer activities and timescales – It is typically not possible to move immediately to implementation of a technology transfer, as it is necessary to work through the process of clarifying the business case, considering what the alternative options would be, and then undertake detailed design and procurement of the preferred solution. For this reason, PIONEERS defined transfer stages and activities based on the categories shown below,
Co-transferability
Click to enlarge

To provide an example, transfer activities for the Modal Shift in the Commute of Port Employees have involved two knowledge exchange sessions involving all four ports, to build understanding of the demo aims and approach. Materials provided by Port of Antwerp-Bruges were used to undertake employer and employee mobility surveys at the Ports of Barcelona and Constanta, helping to inform options appraisal of the best sustainable mobility measures to pursue. Both ports have included sustainable mobility objectives and measures in their GPMPs, providing the basis for the design and implementation of mobility measures in the future, such as improved public transport links or creation of cycle lanes to and within the port area.


Step 4: Transfer implementation, monitoring and review – In many cases the transfer process is iterative, requiring completion of the knowledge exchange, research and options appraisal stages to help generate a clear picture of the technical solution required and define next steps. The timescales for working through the stages could vary from a few months (e.g. for a digital solution) to several years, if regulatory changes, feasibility studies and/or complex procurement procedures are necessary. A process for monitoring progress and reviewing transfer aims on a regular basis is therefore recommended, to provide a series of decision-point gateways.


Within PIONEERS, the transfer process was divided into three main waves, originally with the intention that partners would focus on different demos at different times over a period of ~4 years.. During the project it became clear that related transfer activities would need to continue from one period to the next, and the wave structure allowed for monitoring of overall progress.


Port-related conditions and readiness

Drawing also on work undertaken in WPs1 and 9, it is recommended that the following factors are used to support screening of transfer potential (Stage 2) and definition of transfer scope, activities and timescales (Stage 3).

Port-related conditions & readinessDemo examples
Physical factorsSome of the demo technologies require specific physical port characteristics to be in place, or to create sufficient value.
Considerations include the scale and complexity of operations, geographic setting (e.g. tidal or deep water, space constraints), and natural resources (materials and renewable energy).
Energy from water currents – this hydropower demo has been implemented at a tidal lock at the PoAB. A limited number of other ports have similar infrastructure, so opportunities with inland waterways were also explored.
Green, circular concrete – the demo involves upcycling of find sands excavated on-site at PoAB for use in new quay walls. Many ports undertake land reclamation using dredged materials (rather than needing to excavate land to create port area), which represents a different form of material recycling.
Operational factorsPresence of existing equivalent or related technical systems (requiring integration),
Technical readiness of ports to implement technologies, including (where relevant):
– availability of renewable energy and hydrogen supply networks.
– status of enabling digital infrastructure (e.g. 5G network) and systems (e.g. Port Community System).
Hydrogen heating and dual-fuelled straddle carriers – cost and availability of hydrogen is a major hurdle for the transfer of these demos. Some ports are positioning themselves as hydrogen import and storage hubs, while for others there are no detailed plans and timescales for making the fuel available.
Vessel tracking using a camera network, 5G and artificial intelligence – the availability of a fibre optic or 5G network at a port is a necessary pre-condition for the transfer of this demo. PoC have plans to install a 5G network and introduce a Port Community System, which would provide the foundations for introducing further digital technologies.
Organisational
factors
Readiness of regulatory framework to enable technology implementation (e.g. in relation to automation).
Capacity of port authority and/or other stakeholders to implement and operate technology (e.g. overall resource levels and completion of training)
Commercial readiness and financial capacity of technology provider to expand to new Member States
Autonomous/remote control of inland vessels – demo activities at PoAB and across Flanders are helping to inform the creation of a regulatory framework for the inland waterway networks linking to the Rhine (Belgium, Germany, the Netherlands). Once this framework is set, this could provide the model for other regions across Europe.
Port Digital Twins – digital twin systems such as PoAB’s APICA have been developed by large IT departments, which could not be sustained at all ports. Different levels of service (e.g. basic, intermediate and advanced) and prioritisation of uses cases need to considered during transfer discussions.

Throughout PIONEERS it has been necessary to adapt the type and sequence of transfer activities, depending on the characteristics and readiness level of the port and the nature of the green port technology (i.e. vehicle, infrastructure or digital). The transfer process set out here is intended to provide guidelines and pointers, based on the experience of the project, to support the design of future co-transferability processes.