How to calculate your
carbon footprint
The calculation methodology behind a Scope 1, 2 and 3 greenhouse gas inventory: the standards, the data sources, the assumptions and the emission factors, block by block.
Source: PIONEERS D2.15, Green Ports Master Plan Handbook · Port of Constanța
The process for calculating the port authority`s greenhouse gas emissions follow four main steps:
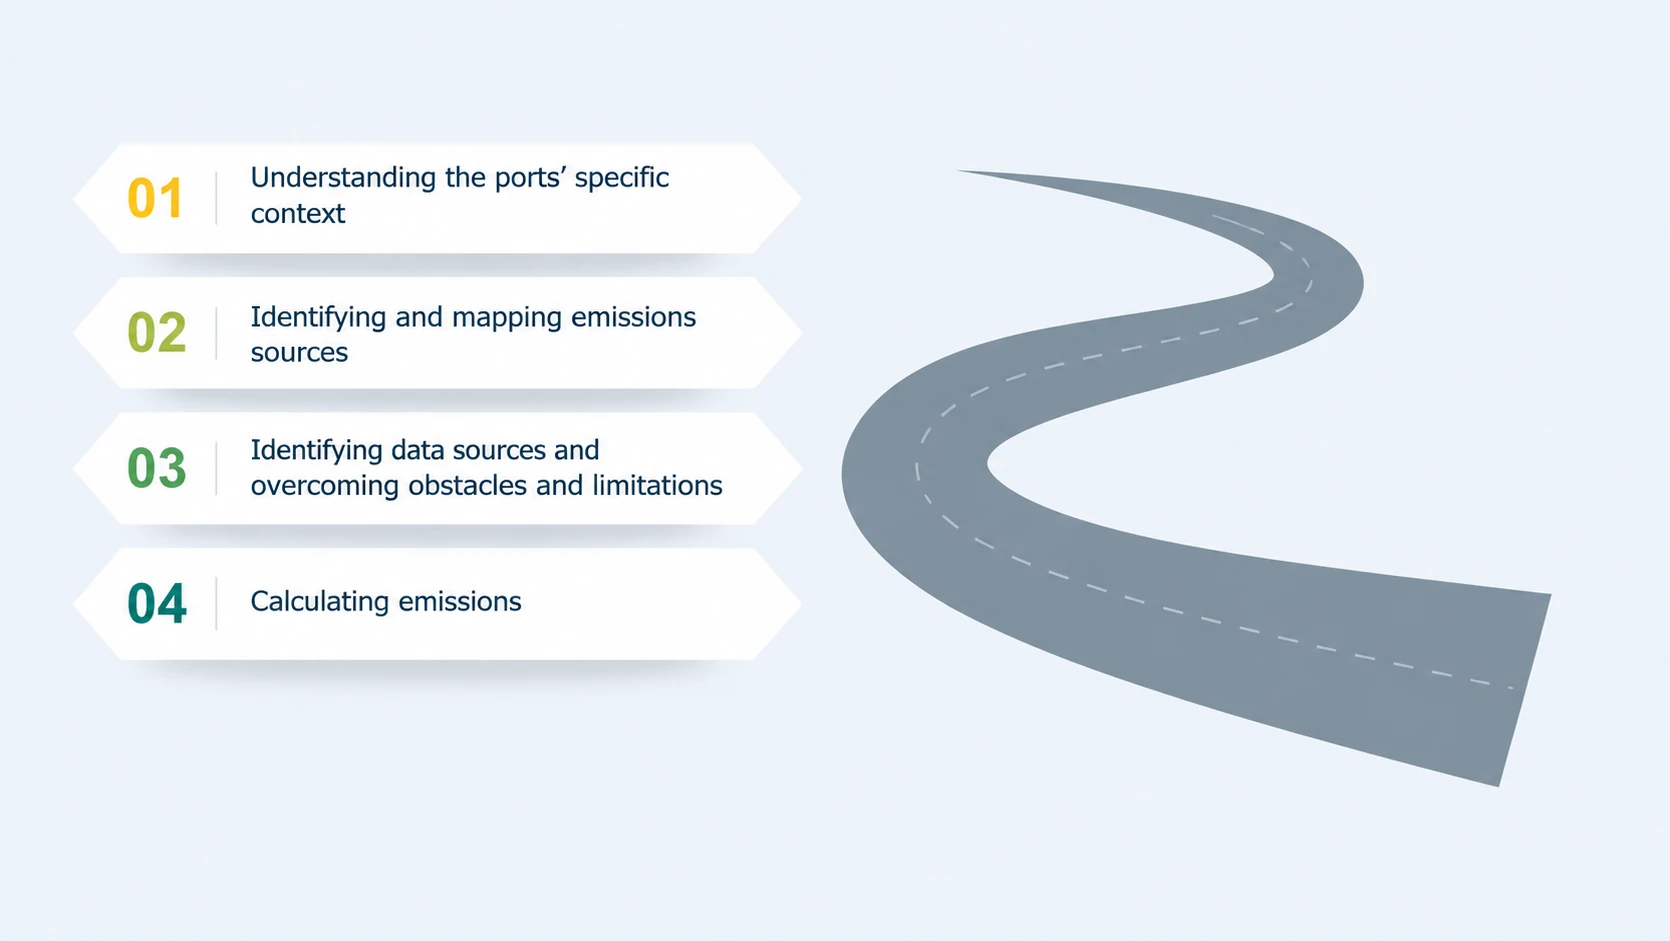
Understanding the port context
An accurate emissions inventory begins with clearly defining the organisational and operational boundaries of the assessment. The inventory focuses exclusively on activities that are directly managed or controlled by the port authority in the port perimeter. This approach ensures that reported emissions reflect areas where the organisation can implement and monitor improvement measures.
The assessment includes emissions generated through the operation and maintenance of port infrastructure, energy consumption in buildings, fuel use by the vehicle fleet and technical vessels, leased assets, outsourced services, employee commuting, business travel, and procurement activities. Emissions generated by commercial shipping or by independent terminal operators are not included because these activities are outside the operational control of the port authority.
Defining these boundaries at the beginning of the process provides a transparent basis for reporting, ensures consistency over time, and allows future inventories to be compared reliably.
Identifying and mapping emissions sources
After defining the assessment boundaries, ports need to identify all activities that generate greenhouse gas emissions and grouped them according to GHG Protocols reporting categories. This structured approach ensures that all relevant emission sources are considered while avoiding overlaps or double counting.
The inventory distinguishes between three categories of emissions:
- Direct emissions (Scope 1): emissions from fuel combustion, heating systems, port vehicles, technical vessels and refrigerants owned or operated by the port authority.
- Indirect energy emissions (Scope 2): emissions associated with purchased electricity used in buildings and operational facilities.
- Other indirect emissions (Scope 3): emissions generated throughout the value chain, including purchased goods and services, waste management, business travel, employee commuting and leased assets.
Grouping emissions into these categories helps identify where the largest impacts occur and supports the development of targeted reduction measures.

Collecting and managing reliable data
Reliable emissions calculations depend on the availability and quality of operational data. Therefore, Ports need to define the required information for each emission source and identify the availability of the required data within the organisation. This process involved mapping data owners, reviewing existing records and assessing the completeness and quality of the available information.
The inventory combines data from multiple operational and administrative sources, including energy and fuel purchase records, meter readings, fleet consumption logs, maintenance records, procurement data, waste management records and employee mobility information.
Because the required information originated from different departments, establishing clear responsibilities for data collection is essential. Early coordination reduced inconsistencies, improved data quality and shortens the overall assessment process.
In case specific information is unavailable, the port applied documented assumptions based on recognised international guidance. Recording these assumptions ensures that future inventories remain transparent and comparable over time.
Applying a standardised calculation methodology
Ports can calculate greenhouse gas emissions using internationally recognised accounting principles and emission factors. Applying standard methodologies allows results to be compared with future reporting years and with other ports following the same approach.
For each activity included in scope 1, scope 2 and scope 3, operational data can be converted into greenhouse gas emissions using recognised emission factors. Where direct activity data were not available, transparent estimation methods can be applied and documented.
You can find information about calculation methodologies, emission factors and assumptions in the section below.
Standards, data sources and emission factors
Open a block to see the data sources, the calculation methodology, the key assumptions and the emission factors used for it.
Standards used
Standards used
For the determination of port authority’s carbon footprint, the following calculation standards were used:
- GHG Protocol Corporate Accounting and Reporting Standard: provides the core principles for the calculation, verification, and reporting of emissions.
- GHG Protocol Scope 2 Guidance: standardises the way companies measure emissions from purchased electricity, steam, heating, and cooling (referred to as “Scope 2 emissions”).
- Corporate Value Chain (Scope 3) Accounting and Reporting Standard: establishes the Scope 3 emission categories, as well as the principles and calculation boundaries.
- GHG Protocol Scope 3 Calculation Guidance: provides practical guidance for the calculation of emissions within Scope 3.
Scope 1
Road fleet and technical vessels
Data sources
- Financial records on fuel purchases (diesel/petrol receipts/invoices).
- Logbooks / consumption records for the road fleet and technical vessels (where available).
Calculation methodology
- Emissions were determined from the quantities of fuel purchased (liters), converted into tCO₂e using standard combustion emission factors from the DEFRA, 2024 dataset.
- The greenhouse gases included in the result are CO₂, CH₄ and N₂O.
- For technical vessels, the same diesel/gasoil emission factors were applied, in line with the DEFRA methodology for liquid fuels used in transport.
- The calculation covers only the consumption of the company’s own fleet; trips made using third-party transport providers are reported under Scope 3.6 (Business travel).
Key assumptions
- N/A
Main emission factor sources
- DEFRA, 2024 – conversion factors published by the UK Government, Department for Energy Security and Net Zero
Stationary combustion
Data sources
- Internal meter readings and records for natural gas purchases (m³),
- Financial records for fuel purchases for generator sets (diesel/petrol) and LPG/butane used in operations (welding, sleeve heating).
Calculation methodology
- Natural gas: volumes in m³ were converted into tCO₂e using DEFRA 2024 emission factors.
- The greenhouse gases included in the result are CO₂, CH₄ and N₂O.
- Generators and LPG/butane: fuel quantities in litres were converted into tCO₂e using DEFRA, 2024 emission factors for liquid/gaseous fuels used in stationary combustion.
Key assumptions
- Generators are used occasionally (testing/maintenance or back-up in emergency situations), not in continuous operation; emissions are therefore based on actual fuel consumed.
- Butane is used for operational purposes (welding / sleeve heating), and the combustion factors applied correspond to these technical uses.
Main emission factor sources
- DEFRA, 2024– Gaseous and liquid fuels (natural gas, diesel/petrol for generators, LPG/butane).
Fugitive emissions
Data sources
- Internal records on air-conditioning systems, including the hosting department, equipment name, internal code, refrigerant type, refrigerant charge (kg) and number of units.
Calculation methodology
- For the identified equipment, an annual leakage rate of 5% of the refrigerant charge was applied, in line with IPCC/TEAP Special Report – 5.1.1.3 Ducted split residential air conditioners.
- Emissions were calculated as: 5% × refrigerant quantity (per gas type) × emission factor (GWP) for that refrigerant, using DEFRA (UK) 2024 values.
- The greenhouse gases covered include CO₂, HFCs and PFCs.
Key assumptions
- The 5% annual leakage rate was used as a standard value in the absence of detailed records of refrigerant top-ups during the reporting year, consistent with IPCC/TEAP recommendations for this type of equipment.
Main emission factor sources
- DEFRA (UK) 2024– Refrigerants (GWP100).
- IPCC/TEAP Special Report – 5.1.1.3 Ducted split residential air conditioners (for the 5% annual loss assumption).
Scope 2
Purchased energy (electricity)
Data sources
- Internal procurement and consumption records
- Energy labels / supplier declarations (energy mix and emission factor).
Calculation methodology
- Emissions from electricity consumption were calculated using the two approaches defined by the GHG Protocol:
- Market-based calculation: supplier-specific emission factors from energy labels were applied. These factors are expressed in kgCO₂eq and include contributions from CO₂, CH₄ and N₂O.
- Location-based calculation: the national grid emission factor for the Romanian power system, published by ANRE, was used. This factor is also expressed in kgCO₂eq and covers CO₂, CH₄ and N₂O.
- Heat/steam: not applicable for 2024; Scope 2 results reflect electricity consumption only.
Boundaries and controls
- Tenants’ electricity consumption is not included in Scope 2; it is treated under Scope 3, downstream leased assets.
Key assumptions
- The difference between the market-based and location-based results reflects the structure of the supplier portfolio (for example, high shares of renewable sources for some suppliers) compared with the national average mix.
Emission factor data sources
- Energy label HIDROELECTRICA (market-based calculation).
- Energy label TINMAR ENERGY (market-based calculation).
- ANRE – national electricity emission factor (location-based calculation): although the 2024 annual report was not available at the time of calculation, the national emission factor appears on the electricity labels published by all suppliers. The factor used for 2024, applicable at national level, was therefore taken directly from one of the two energy labels above.
Scope 3
Purchased goods
Data sources
- Financial records and 2024 purchasing register: supplier list, invoiced amounts, descriptions.
- Accounting extracts (expense classes) used to distinguish goods from services.
Calculation methodology
- Emissions were calculated using the spend-based method, applying the financial values of goods purchased in 2024.
- Each supplier was assigned an EXIOBASE 2022 sector according to its commercial profile and type of products sold, and the corresponding value-based emission factor (kgCO₂eq/RON) was then applied to the total amount spent.
- Items already covered under other scopes/categories (e.g. fuels, electricity/water, own transport) were excluded to avoid double counting.
- EXIOBASE emission factors are provided in EUR; these were converted into RON using the annual average exchange rate published by the National Bank of Romania (BNR) and adjusted with the annual inflation rate published by the National Institute of Statistics (INS).
- Results were aggregated at overall category level “Purchased goods and services” and separately at the “Goods” subtotal (material purchases).
- The emissions include CO₂, CH₄, N₂O, SF₆, HFCs and PFCs. The last three greenhouse gas groups mainly arise from the production of electrical and electronic equipment.
Key assumptions
- The supplier–EXIOBASE sector mapping was based on the supplier’s commercial profile (NACE code, website, invoice descriptions); it was not broken down to individual product/article level.
- Lines with a “0” factor in the working file were excluded from the calculation because they were not applicable or were already accounted for under Scope 1 or 2 (e.g. fuels).
Main databases for emission factors
- EXIOBASE 2022 (monetary emission factors by economic sector, kgCO₂eq/RON)
- INS, annual inflation rate
- BNR, annual average exchange rate (2023, 2024)
Purchased services
Data sources
- Financial records and 2024 purchasing register: supplier list, invoiced amounts, descriptions.
- Accounting extracts (expense classes) used to distinguish goods from services.
Calculation methodology
- Emissions were calculated using the spend-based method, applying 2024 financial data corresponding to the value of services purchased and multiplying these amounts by the relevant EXIOBASE 2022 emission factors (kgCO₂eq/RON).
- To select the most appropriate EXIOBASE factors, each supplier was mapped to a sector/emission factor consistent with its main activity and/or NACE code.
- EXIOBASE emission factors are provided in EUR. These values were converted into RON using the annual average exchange rate published by the National Bank of Romania (BNR) and adjusted with the annual average inflation rate published by the National Institute of Statistics (INS).
Key assumptions
- The supplier–EXIOBASE sector mapping was based on the supplier’s commercial profile (NACE code, website, invoice descriptions) and was not detailed down to individual items or units.
Main databases for emission factors
- EXIOBASE 2022 (monetary emission factors by economic sector, kgCO₂eq/RON)
- INS, annual inflation rate
- BNR, annual average exchange rate (2023, 2024)
Capital goods
Data sources
- Financial records and 2024 CAPEX / commissioning (PIF) register (asset acquisition values).
Calculation methodology
- Emissions were calculated using the spend-based method, similarly to the “Purchased goods and services” category.
- Only assets commissioned (PIF) in 2024 were included, applying the capitalization threshold (> 2,500 RON per asset).
- Each asset was mapped to an EXIOBASE 2022 sector according to the technical nature of the capital good commissioned.
- Monetary emission factors (kgCO₂eq/RON) from EXIOBASE 2022 were applied to the entry value (RON) of each asset, and results were then aggregated at category level.
- For complex works (projects with several tranches), the values of all tranches related to the same asset were summed.
- Costs that do not represent the asset itself (such as design, permits, fees) were excluded from the calculation.
- EXIOBASE factors originally expressed in EUR were converted into RON, in line with the methodology applied and described for the “Purchased goods and services” category.
Key assumptions
- The values used are those available at reporting date in the PIF records.
- EXIOBASE mapping was carried out at asset level, not based on detailed material “recipes”.
- For future inventories, where quantity data are available (for example m³ of concrete, tons of steel) or product EPDs, it will be possible to move towards physical emission factors, improving accuracy.
Main databases for emission factors
- EXIOBASE 2022 (monetary emission factors by economic sector, kgCO₂eq/RON)
- INS, annual inflation rate
- BNR, annual average exchange rate (2023, 2024)
Waste
Data sources
- Waste management plan/report and internal handover/traceability records;
- Annual reports submitted in official systems (e.g. operational registers / PRODESS / TRAT), with quantities broken down by waste code.
Calculation methodology
- For each waste stream, the quantity handed over (tons) was multiplied by the emission factor specific to that waste type and the treatment route, expressed in kgCO₂eq and including contributions from CO₂, CH₄ and N₂O.
- Wastewater volumes were converted into tCO₂e using the relevant factors for treatment at wastewater plants, which include CO₂, CH₄ and N₂O generated by the treatment processes and sludge management.
- Results were aggregated at category level, avoiding any double counting with other emission categories (e.g. combustion reported under Scope 1 or transport activities under Scope 3).
Key assumptions
- For waste streams without a clearly recorded treatment method, standard DEFRA emission factors were applied for the most commonly used treatments associated with that waste code (conservative approach).
- Minor adjustments may occur if quantities are reconciled at a later stage (e.g. weighing/traceability corrections).
Main databases for emission factors
- DEFRA (UK) 2024– UK Government GHG Conversion Factors (solid/liquid waste; typical treatment routes).
Upstream transport and distribution
Data sources
- Internal sources on distances travelled by suppliers calculated using Google Maps.
Calculation methodology
- Kilometers travelled were multiplied by the emission factor corresponding to the mode of transport, namely road transport.
Key assumptions
- Distances were determined using Google Maps, so exact routes could not be identified. Transport was therefore assumed to start from the center of the locality where the supplier’s registered office is located. The final destination was assumed to be Gate 1 Constanta Port.
Main databases for emission factors
- DEFRA (UK) 2024– UK Government GHG Conversion Factors
Business travel
Data sources
- Records (trip lists: origin–destination, number of people, kilometers per segment, number of hotel nights).
- Accounting summaries/travel orders used to verify expenses and number of nights.
Calculation methodology
- Transport: distances travelled with third-party operators (e.g. airlines) were multiplied by emission factors specific to each transport mode (kgCO₂eq/passenger-km), expressed in kgCO₂eq and including contributions from CO₂, CH₄ and N₂O.
- Accommodation: the number of nights was multiplied by the average emission factor for hotels in the host country (kgCO₂eq/night/room), which includes CO₂, CH₄ and N₂O.
- Aggregation: results were summed at the level of the Business travel category (transport + accommodation). Trips made with the company’s own fleet are not included here, as they are reported under Scope 1.
Key assumptions
- All calculations were based on internal records regarding kilometers travelled, number of people and number of overnight stays.
Main databases for emission factors
- DEFRA (UK) 2024– UK Government GHG Conversion Factors (air transport and other modes, expressed in kgCO₂eq/km).
- For accommodation, where no specific factors were available in DEFRA 2024, values published on the Hotel Footprints platform were used, which provides average emission factors by country (kgCO₂eq/night).
Employee commuting
Data sources
- Internal survey on commuting patterns of employees for their daily trips to and from the office, by transport mode and grouped by distance ranges.
Calculation methodology
- The calculation of emissions in this category includes the average number of days worked physically in the office in 2024 and the daily distances travelled by employees for each transport mode. Emission factors expressed in kgCO₂eq, including contributions from CO₂, CH₄ and N₂O, were applied.
Key assumptions
- 45 employees were excluded from the calculation because they use company vehicles for their daily commute; the emissions generated are already included in Scope 1.
Main databases for emission factors
- DEFRA (UK) 2024– UK Government GHG Conversion Factors
Downstream leased assets
Data sources
- Internal records on the areas leased to third parties for the 155 rental spaces.
Calculation methodology
- As no exact energy consumption data were available for each leased space, emissions were estimated using an area-based method. To determine the specific energy consumption per square meter, reference values from the study Evolution of the Payback Period for Energy-Efficient Residential Buildings in Romania in the Last Decade were used, which indicate an average annual consumption of 250 kWh/m² for buildings in Romania.
Key assumptions
- It was assumed that all the energy associated with the leased spaces is consumed by tenants and is proportional to the occupied area (m²), without differentiating between types of use (office, storage, technical space, etc.).
- For all 155 leased spaces, the same average annual consumption of 250 kWh/m² was applied, as indicated in the Evolution of the Payback Period for Energy-Efficient Residential Buildings in Romania in the Last Decade, assuming this value is representative. The energy thus quantified includes both electricity and natural gas.
Main databases for emission factors
Fuel & energy related activities
Data sources
- Internal records on fuels, electricity and gas consumption not included in Scope 1 and Scope 2.
Calculation methodology
- The calculation followed the same general approach as for Scope 1 and Scope 2 (for energy and fuels), with the only difference being the type of emission factors used, which reflect the specific nature of this category (network losses and upstream generation), as follows:
- For fuels, the quantities already used and reported in Scope 1 were taken as the activity data and multiplied by the well-to-tank (WTT) emission factors specific to each type of fuel (kgCO₂eq/unit), based on DEFRA 2024. These factors include emissions from extraction, processing and transport up to the point of delivery and cover CO₂, CH₄ and N₂O, expressed in tCO₂eq.
- For electricity, upstream emissions and grid losses were estimated as follows: the electricity consumption used in Scope 2 was also used to estimate upstream emissions by applying the emission factors for electricity generation (upstream electricity), in line with DEFRA 2024. Losses in the transmission and distribution network were estimated by applying a 5% share to the electricity consumption and multiplying by the specific emission factors for Transmission & Distribution, expressed in kgCO₂eq (including CO₂, CH₄ and N₂O).
- The resulting emissions were aggregated at the level of the Scope 3 category Fuel- and energy-related activities. Direct combustion emissions (from the operation of company-owned equipment and vehicles) and the actual production of purchased electricity are reported separately under Scope 1 and Scope 2, respectively, thereby avoiding double counting.
Key assumptions
- N/A
Main databases for emission factors
Carbon footprint platform
Main Features
The application provides the following features:
- Manual entry of consumption data through a graphical interface
- Bulk data import using Excel files (XLS)
- Automatic calculation of carbon emissions based on GHG factors for all three scopes (Scope 1, 2 and 3)
- Generation of Word reports with detailed analysis and contextual information
- Export of Excel reports containing raw data for further analysis
- User and department management with granular access control
- Generation of consumption scenarios to support emission-reduction proposals
The application uses a modern microservices-based architecture, with each component running in a separate Docker container. This architecture provides scalability, isolation and ease of deployment.
The application architecture follows a layered architecture model, with a clear separation of responsibilities:
Presentation Layer (Frontend)
→ React.js application with Material UI for the user interface
Application Layer (Backend)
→ Node.js/Express REST API for business logic
→ Python service for report generation
Data Layer
→ MongoDB for structured data storage
→ MinIO for file storage
- Graphical interface for entering consumption data
- Excel file upload and validation for bulk import
- Dashboards and statistics for carbon emissions
- User and department management (for the IT Administrator role)
- Initiation of report generation and download of results
- User authentication and authorization